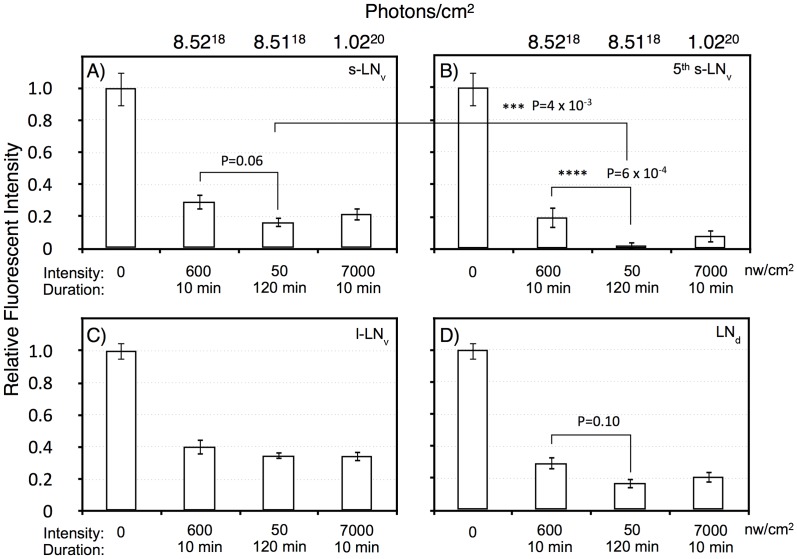
Figure 6. Quantitation of TIM levels in the specific LN subsets as shown in Figure 5.
A) s-LNv. B) 5th s-LNv (PDF negative). C) l-LNv. D) LNd. Intensity/durations were designed based on the data in Figure 2. For each neuronal subset, we show the no light pulse control (0), 600 nw/cm2 10 min, representing a roughly half-maximal intensity-duration; 50 nw/cm2 120 min, an equal-photon exposure to the former, and 7,000 nw/cm2, 10 min, yielding a stronger phase shift. All neuronal classes show highly significant TIM degradation in response to light pulses relative to the no pulse control (P<10−6). The PDF negative 5th s-LNv was visible in 10 of 11 LNv clusters in the no pulse control, and the absolute intensity of TIM IR in this neuron was indistinguishable from the s-LNv or any of the other neuronal clusters: 209±21 (SEM, arbitrary fluorescence units), vs 192±19 for the other s-LNv. Thus, the near disappearance of TIM immunoreactivity in the 5th s-LNv in response to the 50 nw/cm2 120 min light pulse cannot be explained by differential detection sensitivity. This neuron showed TIM immunoreactivity in 6 of 11 LNv clusters following the 600 nw/cm2 10 min light pulse, but only 1 of 11 following the 50 nw/cm2 120 min light pulse. Statistics were performed using two way ANOVA on square root transformed data to better approximate normality (Stat Plus, Analystsoft). Two way ANOVA values for the interaction of specific light pulse x cell types are shown in Table S1. The six LNd neurons are heterogeneous, with only three showing detectable CRY immunoreactivity [34], but our analyses do not detect a subset showing differential TIM degradation.

