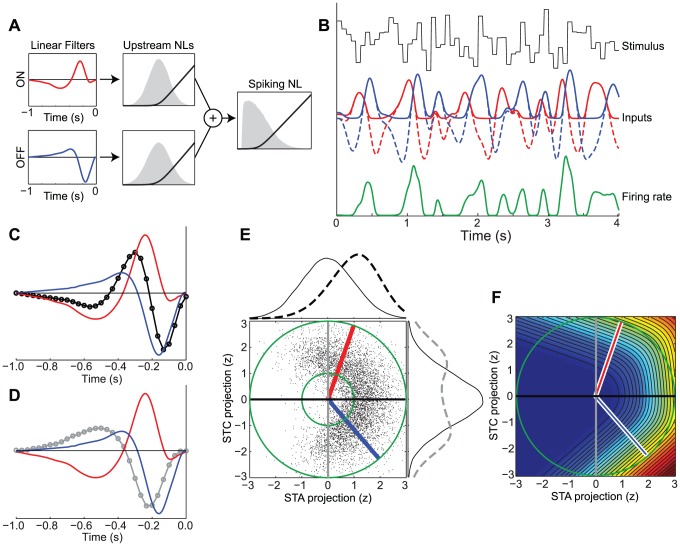
Figure 1. ON-OFF RGC simulation.
A) Schematic showing the ON (top, red) and OFF (bottom, blue) inputs to the simulated ON-OFF RGC. The temporal filters (left) process the stimulus, and the upstream nonlinearities (black, middle) are then applied to the filter outputs. The sum of the two inputs is then passed through the spiking nonlinearity (black, right). The distributions of the stimulus filtered by the ON and OFF pathways, as well as the distribution of their summed input to the simulated neuron are shown as gray shaded regions. B) A simulation showing how the response to a 15 Hz (Gaussian) white noise stimulus is constructed. The stimulus (black) is filtered by the ON and OFF temporal kernels (dashed red and blue), and then transformed by the upstream nonlinearities (solid red and blue). The resulting instantaneous firing rate (green) is given by the sum of these inputs passed through the spiking nonlinearity. C) The STA (black) resembles the average of separate ON (red) and OFF (blue) filters of the generative model. D) Similar to panel C, the first STC filter (gray) resembles a mixture of the ON and OFF filters. E) Stimuli eliciting spikes (black dots) are projected onto the two-dimensional subspace spanned by the STA and first STC filter, shown in units of z-score. The distributions of stimuli corresponding to spikes (dashed lines on top and left) are compared to the marginal stimulus distributions (solid), demonstrating a systematic bias along the STA (horizontal) axis, and an increased variance along the STC (vertical) axis. The true ON and OFF filters (red and blue) are also contained in the STA/STC subspace, as indicated by the red and blue lines lying on the unit circle (green). The inner green circle has a radius of one standard deviation. F) The neuron's firing rate as a function of the stimulus projected into the 2-D STA/STC subspace (shaded color depicts firing rate: increasing from blue to red).

