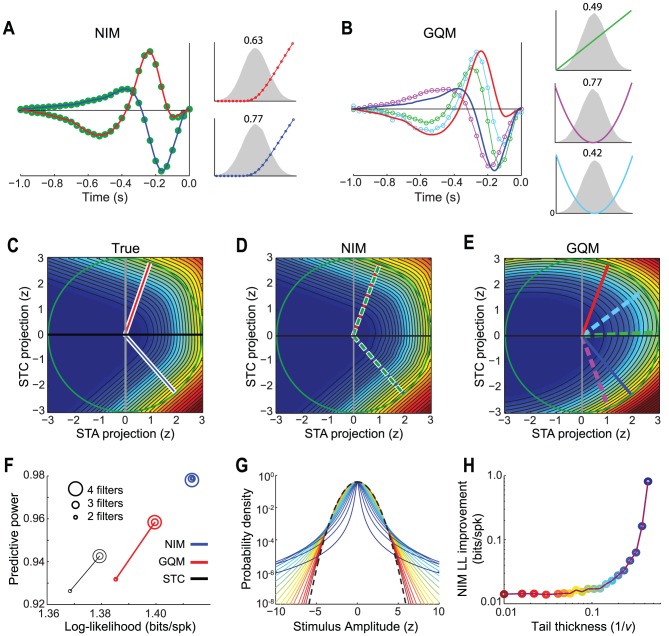
Figure 3. Comparison of NIM and quadratic model.
A) The filters fit by the NIM (green dots) are able to capture the true underlying ON and OFF filters (red and blue), as well as the shape of the upstream nonlinearities (right), which are shown relative to the corresponding distributions of the filtered stimulus (gray shaded). The ranges of the y-axes for different subunits are indicated by the numbers above, for comparison of their relative magnitudes. These ‘subunit weights’ are scaled so that their squared magnitude is one. B) The filters fit by the GQM, consisting of two (excitatory) squared filters (magenta and light blue) and a linear filter (green trace), are different than the true filters (red and blue), but are in the same subspace, as demonstrated in (E). C) The simulated neuron's response function (shaded color depicts firing rate) and true filters (red and blue) projected into the STC subspace (identical to Fig. 1F). D) Response function predicted by the NIM. The filters identified by the NIM (dashed green) overlay onto the true filters. E) Same as (D) for the GQM, with colored lines corresponding to the filters in (B). F) Model performance is plotted for the STC, GQM, and NIM fit with different numbers of filters (indicated by different circle sizes). Log-likelihood (relative to the null model) is shown on the x-axis, and the ‘predictive power’ [99] is shown on the y-axis; both were evaluated on a simulated cross-validation data set. The NIM (blue) outperforms the GQM (red), both of which outperform a nonlinear model based on the STC filters (black, see Methods). The STC model and GQM achieve maximal performance with 3 filters, since this is sufficient for capturing the best-fit quadratic function in the relevant 2-D stimulus subspace, while the NIM achieves optimal performance with two filters, as expected. G) To determine how model performance depends on the stimulus distribution we simulated the same neuron's response to white noise luminance stimuli with Student's t-distributions, ranging from Gaussian (i.e., ν = ∞, dashed black) to “heavy tailed” (decreasing ν from red to blue). H) The log-likelihood improvement of the NIM over the GQM increases as a function of the tail thickness (parameterized by 1/ν) of the stimulus distribution (which also determines the tail thickness of the filtered stimulus distributions). The GQM is able to provide a very close approximation for large values of v (i.e., a more normally-distributed stimulus), but has lower performance compared to the NIM for more heavy-tailed stimuli.

