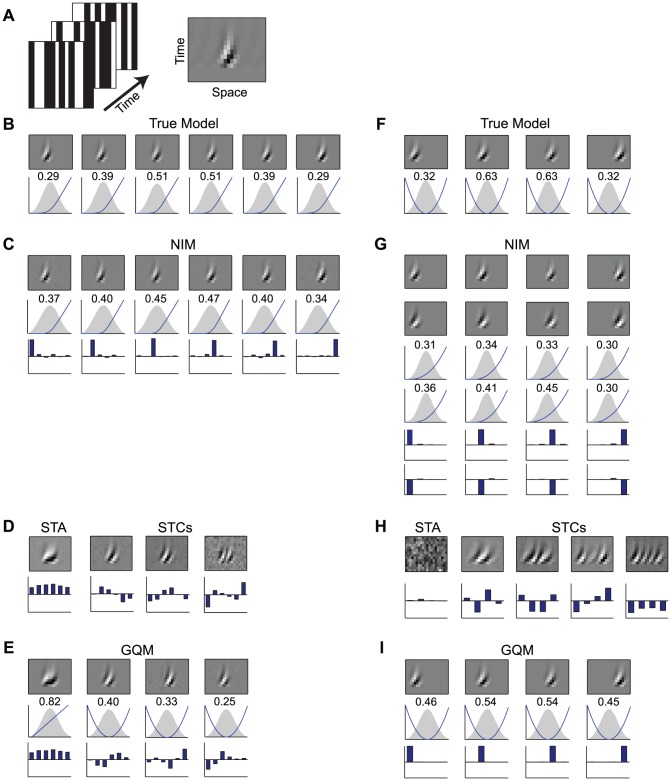
Figure 6. Modeling stimulus selectivity arising from many inputs.
A) Simulated V1 neurons are presented with one-dimensional spatiotemporal white noise stimuli (left). Their stimulus processing is constructed from a set of spatiotemporal filters (example shown at right), depicted with one spatial dimension (x-axis) and time lag (y-axis). B) The first simulated neuron is constructed from six spatially overlapping direction-selective filters (top), similar to those observed experimentally for V1 neurons. Below, the corresponding filtered stimulus distributions are shown along with the respective upstream nonlinearities (blue). C) The NIM identifies the correct spatiotemporal filters (top), as well as the form of the upstream nonlinearities (middle). The projections of the NIM filters onto the true filters (bottom) illustrate that the NIM identifies the true filters. D) The STA for the simulated neuron (left), along with the three significant STC filters (right) are largely contained in the subspace spanned by the true filters, but reflect non-trivial linear combinations of these filters (bottom). E) The GQM is composed of a linear input (left) and three excitatory squared inputs (right). While the GQM filters are more similar to the true filters, they also represent non-trivial linear combinations of them (bottom). F) The second simulated neuron consists of four similar, but spatially shifted, inputs that are squared. G) The NIM represents each true (squared) input by an opposing pair of rectified inputs. H) The STA (left) does not show any structure because the neuron's response is, by construction, symmetric in the stimulus. The four significant STC filters (right) represent distributed linear combinations of the four underlying filters. I) The GQM recovers the correct stimulus filters, given appropriate sparseness regularization.

