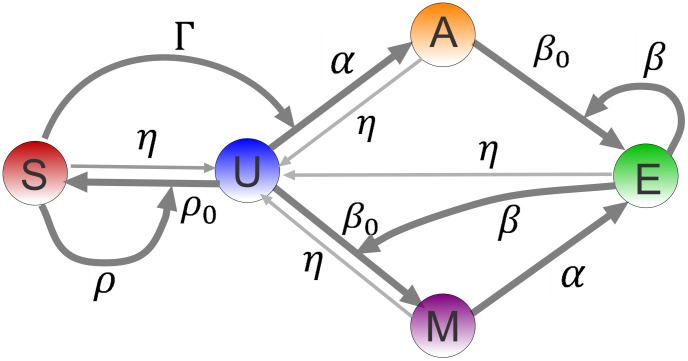
Figure 2. The schematics of the minimal model: On a particular nucleosome,  denotes the silencing mark,
  is no-mark,
  is the acetylation mark,
  is the methylation mark and
  is the active mark.
All straight arrows represent local transitions of nucleosomal marks with rates shown. The thin straight arrows are the (low) overall rate of loss of histone marks. The curved arrows are cooperative interactions, where a neighboring nucleosome, bearing a mark (corresponding to the arrow's origin) influences the local transition of the nucleosome to another mark (corresponding to the arrow's target).

