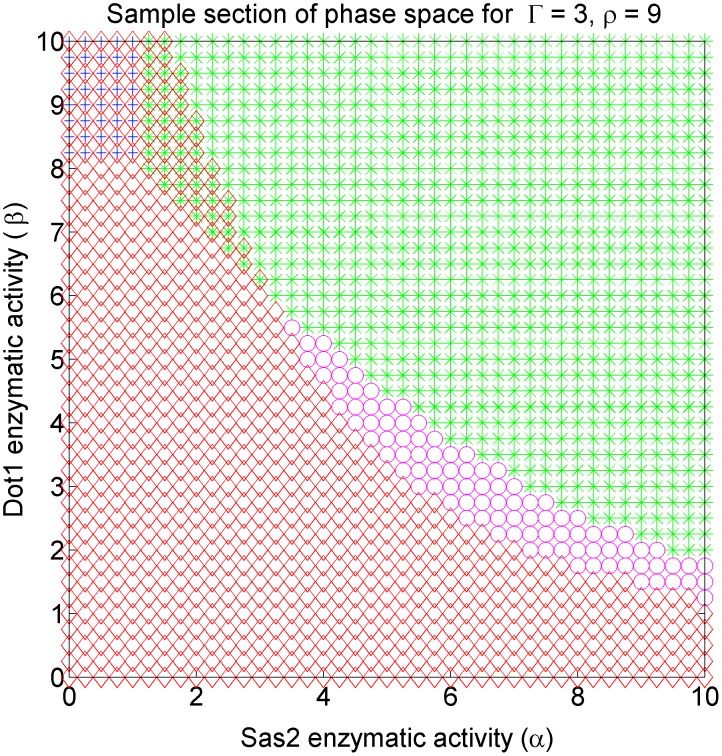
Figure 3. Example section of the models phase diagram showing all the possible phases: The phase space is four dimensional.
This section corresponds to fixing Sir2 deacetylase activity ( ) and Sir cooperative binding rates
  and varying the Sas2 activity (
 ) and cooperative Dot1 activity (
 ). Red diamonds represent region where silenced state is stable, green stars where active state is stable, magenta circles where bivalent state is stable, blue crosses where intermediate state is stable, and regions of overlap of symbols are bistable regions. The bistable solutions merge on
  line to a single solution.

