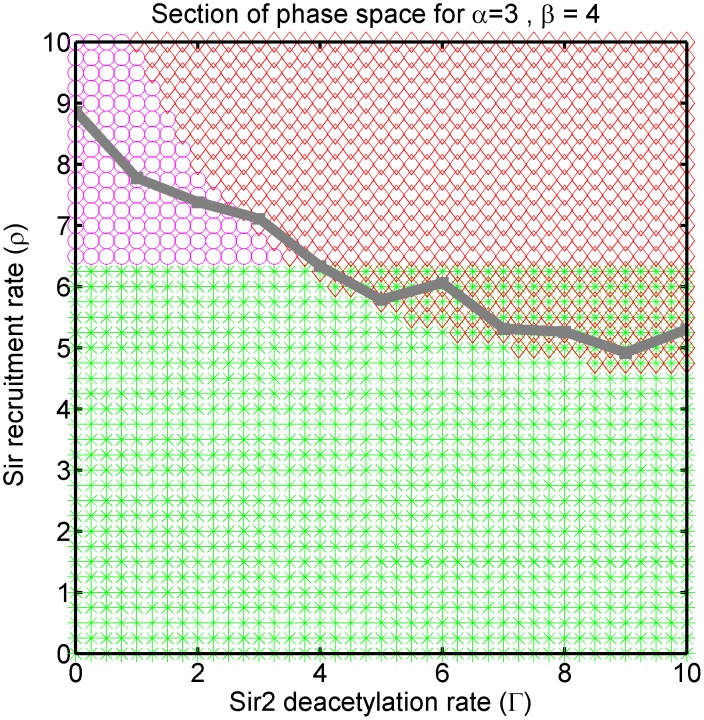
Figure 4. The zero velocity line: Section of phase diagram for varying Sir2 deacetylation activity ( ) and Sir recruitment (
 ), and fixed Sas2 activity (
 ) and Dot1 activity (
 ).
).
For limited supply of silencer proteins the system self-adjusts the parameter  for changing
  to settle on the zero velocity line (determined from simulations) drawn in gray.

