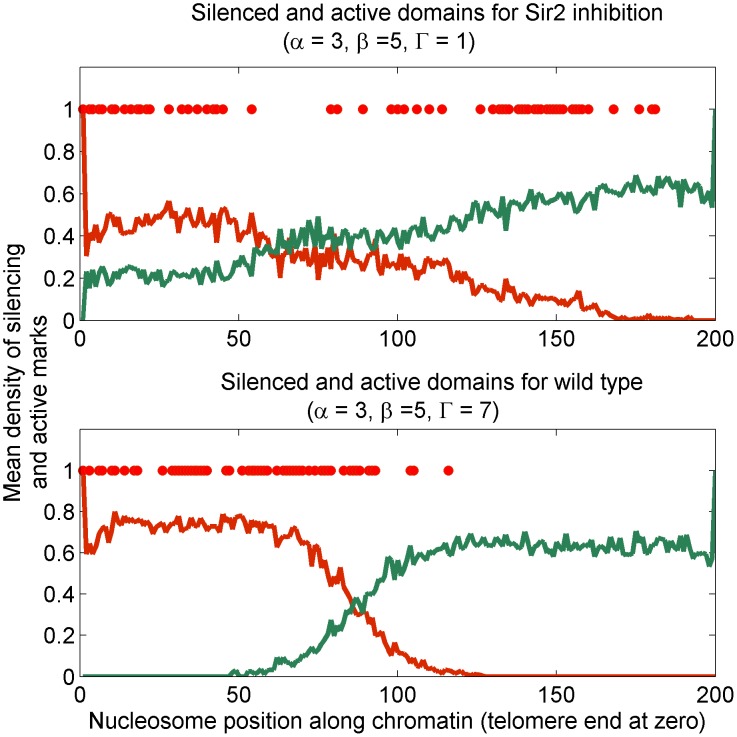
Figure 5. Effect of inhibiting Sir2 activity on Sir domains: Density profile of silencer mark S (red line) and active mark E (green line) in the bivalent state encountered as a result of reducing inhibiting Sir2 activity ( ), determined from lattice simulations.
Top panel shows disruption of silencing boundary for low Sir2 activity compared to (bottom panel) wild-type choice of Sir2 activity. The density profiles are average over many stationary configurations. A single such configuration is shown in dots to emphasize the ill-defined Sir domain in individual samples.

