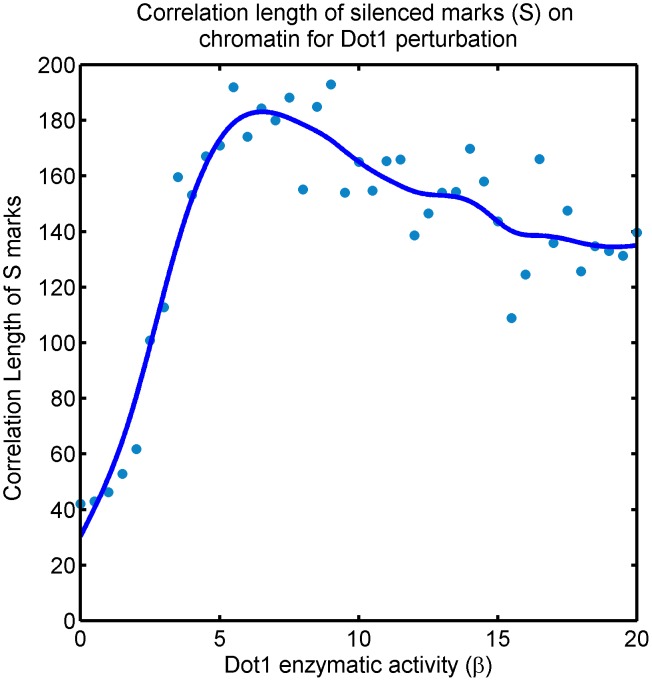
Figure 10. Effect of inhibition and overexpression of Dot1 activity on Sir domains: Correlation length of silenced mark ( ) of the system along the zero-velocity-line in Fig. 4.
There are two transitions, one from silenced-intermediate-bistable to silenced-active-bistable at  and another from silenced-active-bistable to bivalent-monostable at
  , see Fig. 7. The correlation length is high, as expected, in the bistable region (wild-type) where silencing domains are well-established. However, the system continues to enjoys high correlation length in the bivalent phase reached by Dot1 overepxression—long-lived patches of Sir domains persist in this region. For severe Dot1 inhibition, the correlation length drops in the silenced-intermediate-bistable phase, demonstrating that in spite of this state being bistable, silencing domains are ill-established. The scale on the y-axis depends on the (unknown) biophysical parameters of the wild-type system, we are only reporting the trend.

