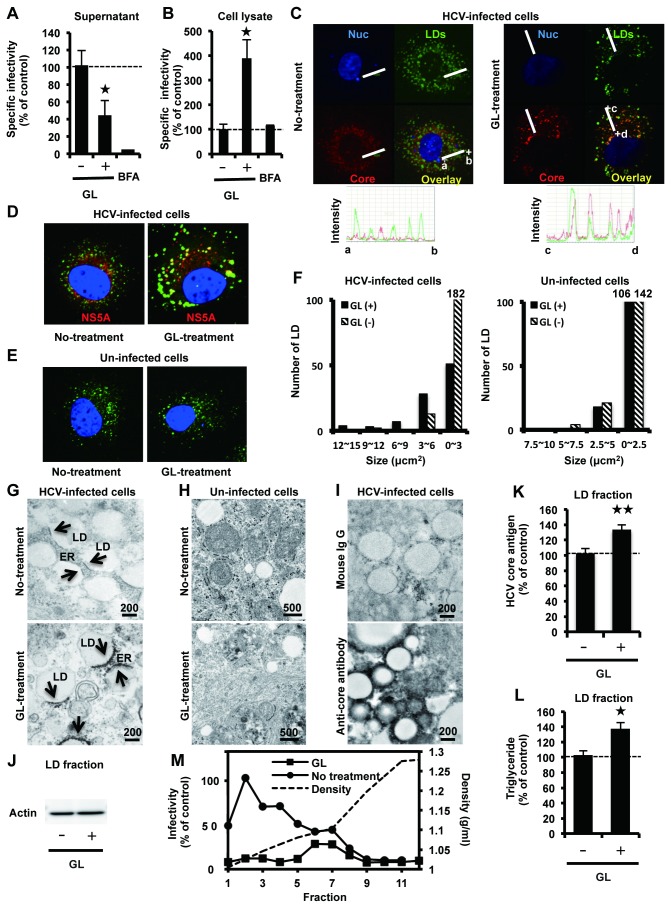
Figure 2. Effects of GL in release of infectious HCV particles.
HCVcc-infected cells were treated with GL at a concentration of 500 µM for 72 hours. Untreated cells were used as controls. Extra- (A) and intracellular specific infectivity (B) were determined. Subcellular co-localization of HCV core (C) or NS5A (D) with LDs in HCVcc-infected cells with or without GL treatment. (E) Un-infected cells. LDs and nuclei were stained with BODYPI 493/503 (green) and DAPI (blue), respectively. (C) Points a and b, as well as c and d, define two line segments that each cross several structures. Intensity profiles along the line segments shown on the bottom of the images. (F) The size of LDs in un-ifected cells (right panel) and HCV-infected cells (left panel) were quantified. Transmission EM of LDs in infected cells (G) and un-infected cells (H) treated with GL at 500 µM. Arrows indicate electron-dense signals (G upper panel) and particles (G lower panel). (I) IEM using the LAB method of LDs in infected cells treated with GL at 500 µM. Mouse IgG (upper panel) or anti-core monoclonal antibody (lower panel) was used for primary antibody. (J) Immunoblotting with anti-actin antibody in the LD fraction. Quantification of HCV core antigen (K) and TG (L) in the LD fraction. The LD fraction was collected from cell lysates. The ratio of HCV core antigen level in the LD fraction to that in total cell lysate was determined. (M) HCVcc-infected cells were treated with GL at 500 µM for 72 hours. Untreated cells were used as controls. Supernatant was ultracentrifuged through a 10-60% sucrose gradient and the infectivity of each fraction was determined. Infectivity of fraction 2 of un-treated cells was assigned the arbitrary value of 100%. The density of each fraction was measured by refractive index measurement. Brefeldin A (1 µM for 24 hours) was used as a positive control for reduced HCV release. Results are expressed as the mean ± SD of the percent of the control from four independent experiments. *P < 0.05, **P < 0.005 versus control (0 µM treatment). Scale bars, 200 and 500 nm.

