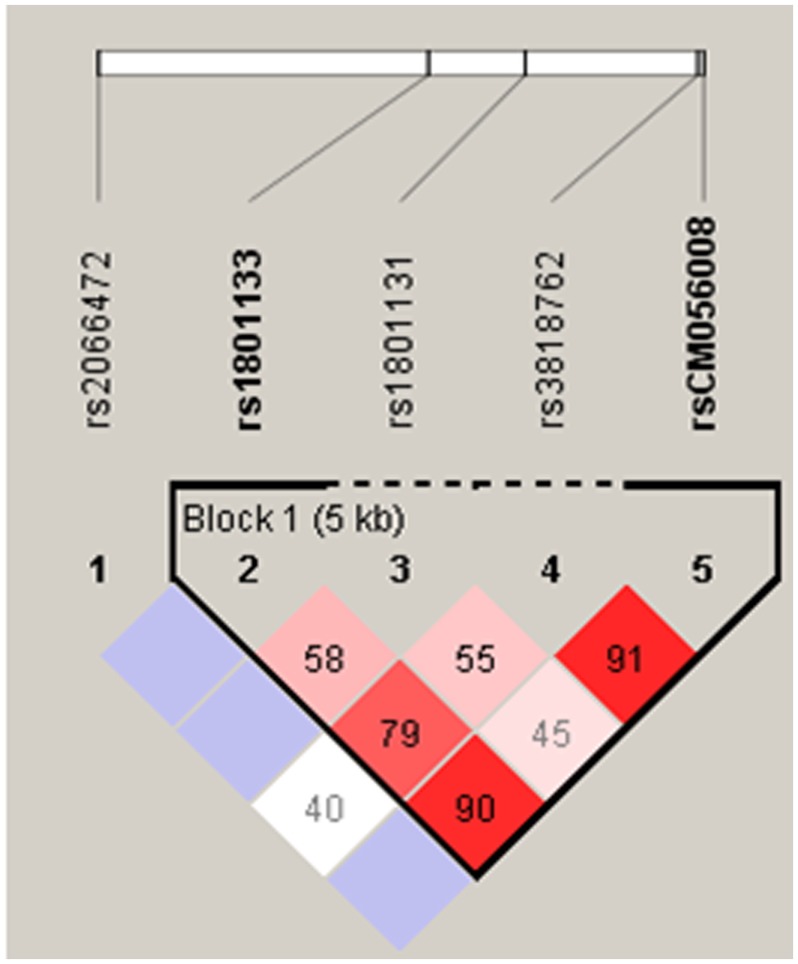
Figure 1. Linkage disequilibrium plot.
The number in each cell represents the LD parameter D′ (×100). Each cell is color graduated related to the strength of LD between the two markers. The rs numbers are SNP IDs taken from the Ensembl database. rs1801133, CM056008 NOIATAUM_DMCH, CM056008 NOIATAUM_DMCH, and rs3818762 are in strong LD.

