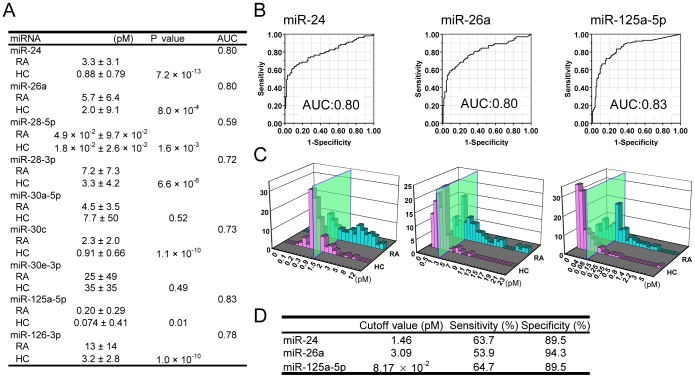
Figure 4. Plasma miR-24, miR-26a and miR-125a-5p differentiated RA from HC with high specificity.
A: Plasma concentrations of eight miRNAs for candidate biomarker and miR-30a-5p for candidate normalizer in RA patients (n = 102) and HC (n = 104). Data are shown as mean ± standard deviation. Area under curve (AUC) was calculated after plotting receiver operating characteristic (ROC) curve. B: ROC curve analyses of miR-24 (left panel), miR-26a (middle panel) and miR-125a-5p (right panel), which showed the highest values for AUC. C: Histograms of plasma concentrations of miR-24 (left panel), miR-26a (middle panel), and miR-125a-5p (right panel). The green panels indicate the cutoff value. D: Sensitivity and specificity of each miRNA test for RA. Cutoff value with higher specificity was selected between the maximum and the maximum minus 0.03 after the maximum of the sum of true positive rate and false positive rate were calculated.

