
Figure 1. Heatmap of RNA-seq data from (a) Pickrell data and (b) Montgomery data.
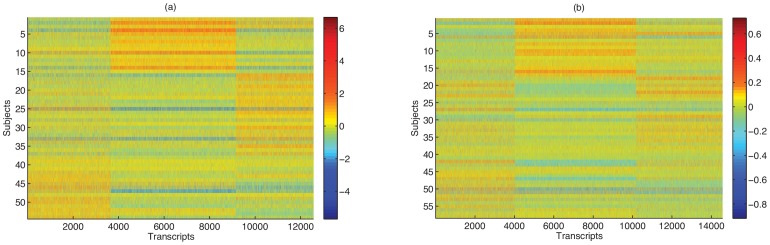
Rows represent subjects (or individuals) and columns represent genes. Using k-means clustering on corresponding RPKM normalized data, subjects are grouped in three clusters and genes are also grouped into three clusters. As observed later, these broad clustering patterns are primarily driven by confounding factors such as sequencing depth.