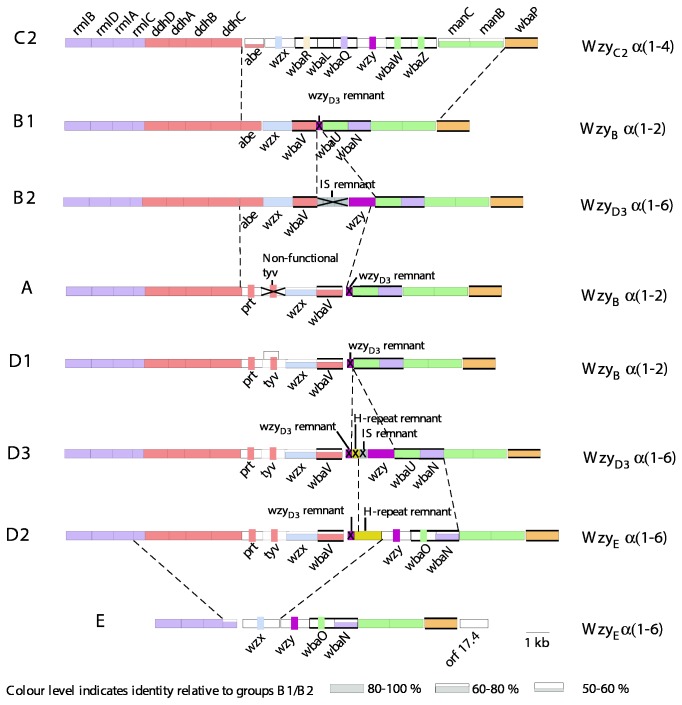
Figure 4. O-antigen gene clusters of the Galactose-initiated S. enterica serogoups.
Genes are colour coded by synthesis pathways. Height of the coloured blocks indicates level of sequence similarity to group B1 genes; if little or no sequence similarity, the gene is colour coded by a vertical strip according to the pathway. Transferase genes are indicated by bold horizontal boundaries. Major junctions between blocks of genes with different relationships or levels of similarity are indicated by dashed lines. Gene names are shown and gene remnants labelled. The O-unit polymerase is shown on the right, named after the group in which it was first found, together with the linkage that it forms. Drawn to scale.

