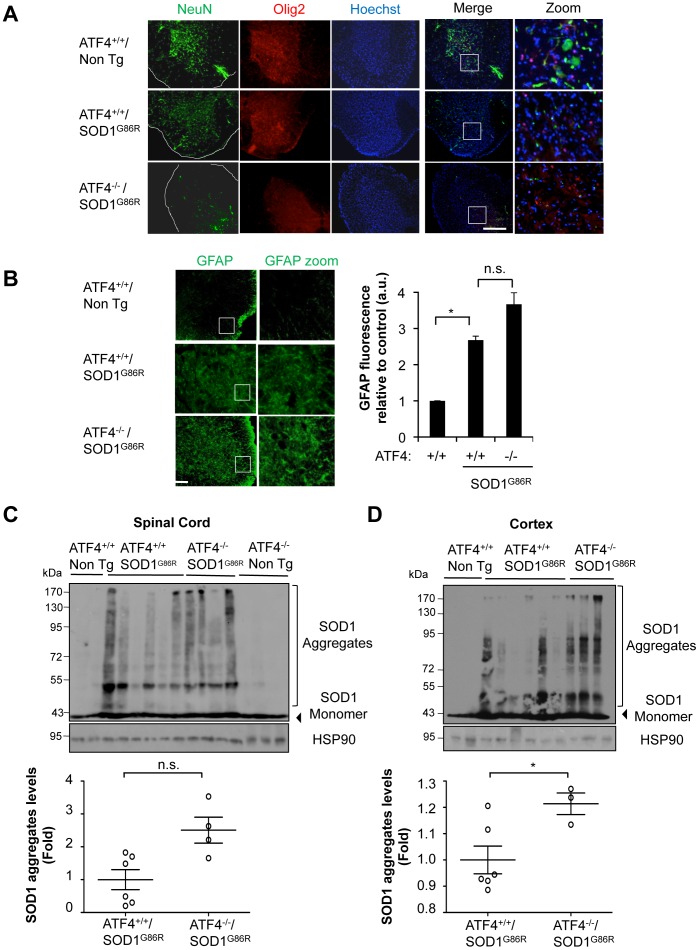
Figure 2. Targeting ATF4 alters SOD1 aggregation in mutant SOD1 transgenic mice.
Histological characterization of ATF4−/−/SOD1G86R spinal cord. (A) Immunofluorescence analysis of NeuN and Olig2 staining in spinal cord tissue derived from ATF4+/+, ATF4+/+/SOD1G86R and ATF4−/−/SOD1G86R at the late disease stage. Hoechst staining is also presented. A merged image of the three staining is provided together with a zoom of the selected area. Bar 250 μm. A representative image is presented of the analysis of three independent animals. (B) In the same tissue described in A, GFAP staining was performed and quantified. A zoom of the selected area is also provided (right panel). The border of the spinal cord tissue is delineated with a white line Bar 100 μm. (C) SOD1 aggregation was determined in spinal cord protein extracts derived from ATF4+/+(N = 2) ATF4+/+/SOD1G86R (N = 6) ATF4−/−/SOD1G86R (N = 4) and ATF4−/− (N = 3) mice at the symptomatic stage using Western blot analysis. Each well represents an independent animal. (D) In parallel, brain cortex was analyzed as described in C. Bottom panels of C and D: Mutant SOD1 aggregation was quantified from experiments presented in C and D, and normalized with the value of HSP90. Average signal of control transgenic mice was normalized to 1. Mean and standard deviation is presented in all plots. p values were calculated with Student's t-test, *: p<0.05.

