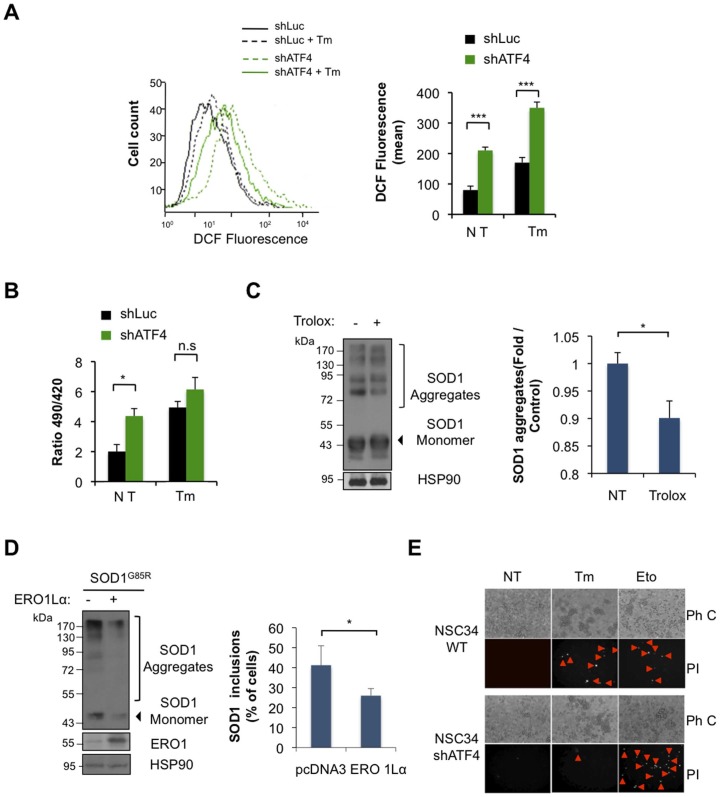
Figure 5. Knocking down ATF4 in NSC34 cells alters the redox state of the ER, contributing to mutant SOD1 aggregation.
(A) ROS levels were determined in shATF4 and shLuc NSC34 cells at basal levels or after treatment with 1 μg/ml Tm for 16 h using dichlorofluorescein (DCF) staining and FACS analysis. Right panel: Quantification of mean DCF fluorescence. (B) The generation of H2O2 inside the ER was determined in shATF4 and shLuc cells after transient expression of HyPer-ERlum construct. After 72 h, cells were treated or not with 1 μg/ml Tm for 6 h and fluorescence emission determined by live cell-imaging microscopy. (C) NSC34 shATF4 cells were transiently transfected with SOD1G85R-EGFP plasmid and treated with 400 mM trolox after 24 h. Two days after mutant SOD1 aggregation was analyzed by Western blot. Left panel: quantification of SOD1 aggregates. (D) NSC34 shATF4 cells were co-transfected with expression vectors for SOD1G85R-EGFP together with ERO1Lα plasmid or empty vector. Left panel: Then, mutant SOD1 aggregation was monitored after 72 h by Western blot (left panel, Bar 50 μm). Right panel: In parallel, mutant SOD1 inclusions were visualized by fluorescent microscopy and quantified. (H) Control and shATF4 NSC34 cells were exposed to 5 μg/ml Tm for 16 h and cell death was detected after propidium iodide (PI) staining, and visualized with a fluorescent microscope. As a positive control, cells were treated for 16 h with 20 μm etoposide (Eto). Data is representative of three independent experiments. Arrows heads shows PI stained cells. Ph C: Phase Contrast. In all plots, mean and standard deviation is presented of three independent experiments. p value was calculated with Students t-test, *: p<0.05.

