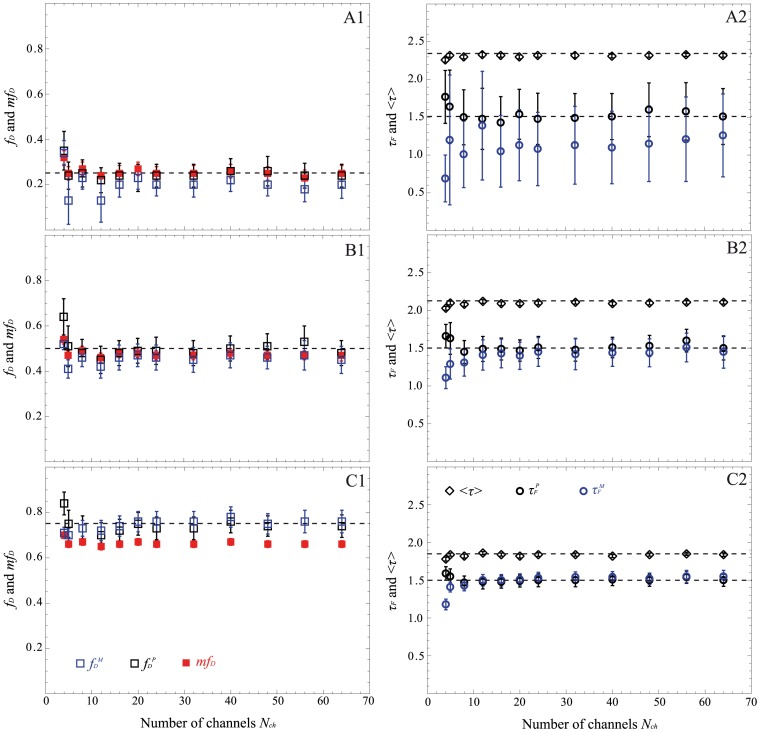
Figure 5. Performance of the non-fitting methods (polar approach in black, moments method in blue and mfD in red) as a function of the number of temporal channels for N = 1000 photons (time gated simulations).
We have considered three fractions of interacting donor fD: 0.25 (A), 0.5 (B) and 0.75 (C). τF and <τ> are reported in the right part whereas fDP, fDM and mfD are indicated in the left. For each condition, the dotted lines represent the simulated values and the markers with error bars represent the corresponding medians and interquartile ranges of 4096 simulated histograms with parameters: τF = 1.5 ns and τD = 2.5 ns.

