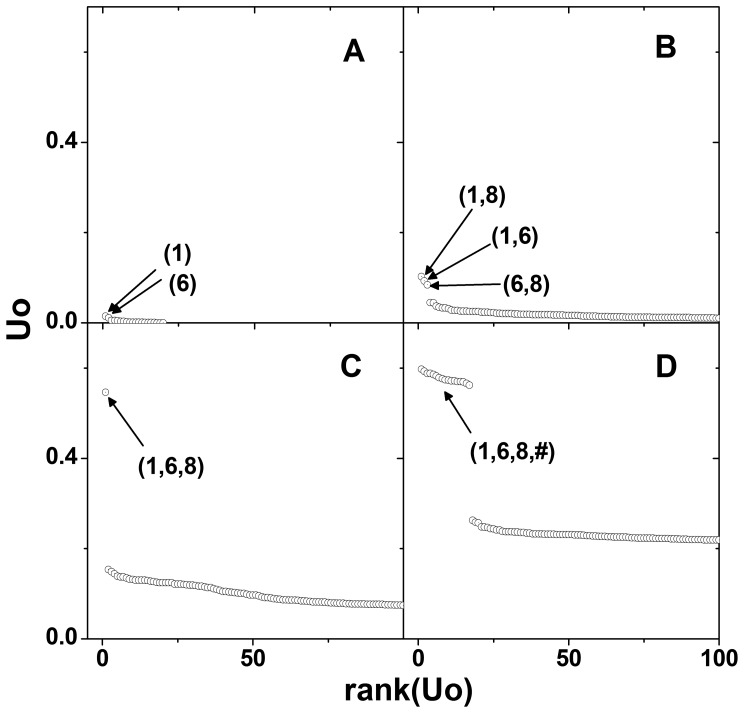
Figure 2. Scree plots of  for MDR open-source data.
Main effects (A), 2nd order interactions (B), 3rd order interactions (C) and 4th order interactions (D) are shown. The observed relative information gain,  , is plotted against the rank determined by the magnitude of
  . Only the top 100 ranked
  s are plotted for each order of interaction. Top ranked SNP names are denoted within the parentheses.

