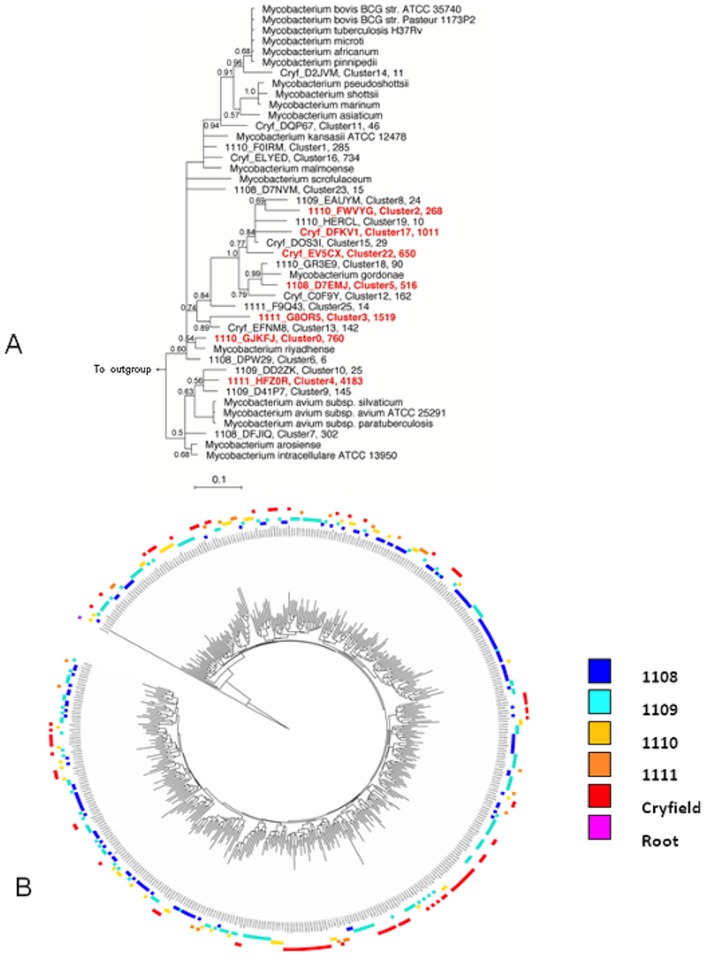
Figure 4. Phylogeny based analysis.
(A) Phylogenetic position of the 33 representative OTU (with the original sequence tag, the cluster number and the total number of sequences) after binning with CD HIT EST at the 3% cutoff the sequences obtained with the APTK16S primer. Predominant clusters are highlighted in red. The tree was made with MrBayes with the PhymL maximum likelihood algorithm and includes a non-redundant list of the best matches of each sequence as defined by the Silva project (Release 104). (B) ITOL drawn tree containing 314 representative sequences for each OTU obtained with the genus specific primer set defined showing topology of sites in the outer ring (see site colour coding) and significant phylogenetic clustering as indicated by the FastUnifrac P test significance (P<0.01).

