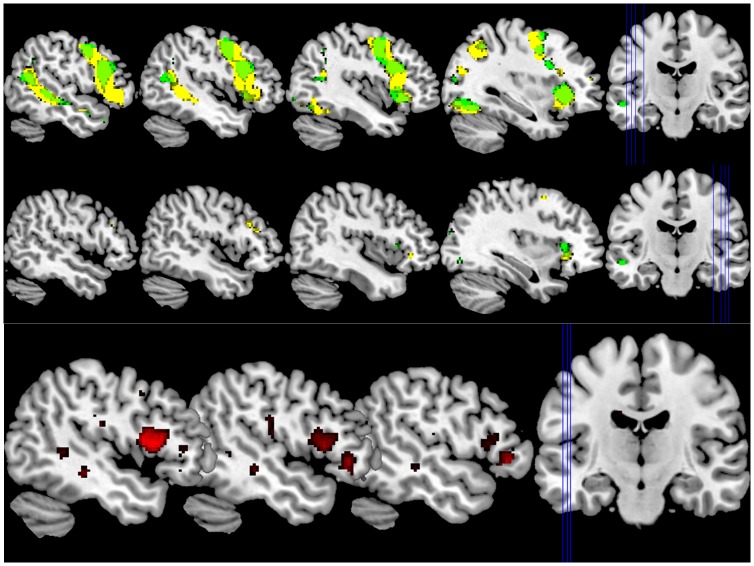
Figure 2. High Inhibition (HI) versus Low Inhibition (LI).
Activation patterns for high PP depicted in yellow and for low PP depicted in green. Differential activation pattern between groups depicted in red. TOP: left hemisphere at x-coordinates (MNI-space) −50, −46, −42, −34 (from left to right). MIDDLE: right hemisphere at x-coordinates (MNI-space) 50, 46, 42, 34 (from left to right). BOTTOM: PP > HC, slices represent x-coordinates (MNI-space) −50, −46, −42 (from left to right).

