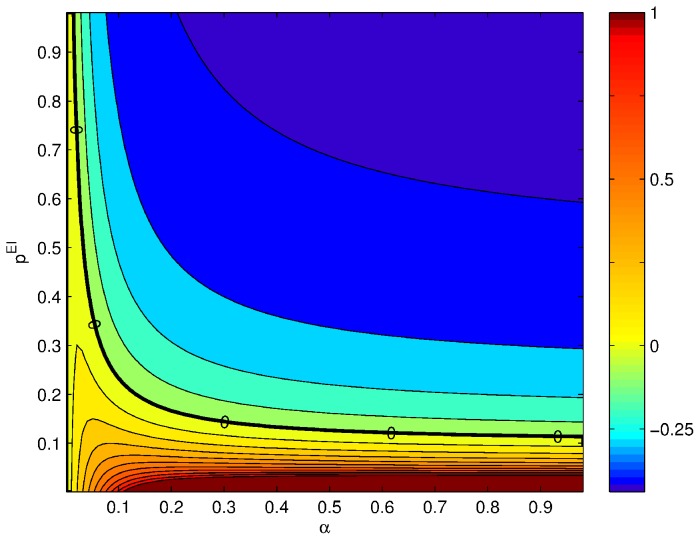
Figure 2. Gain control conditions obtained from the mean field approximation for  ,
,  ,
,  ,
,  and
and  .
.
The contour plot shows the absolute value of the slope of the rate in the excitatory population as a function of the input current  from ORNs. The axes of the plot are ranges of parameters. Strict gain control corresponds to
  slope, eq. (23), indicated by thicker black line.

