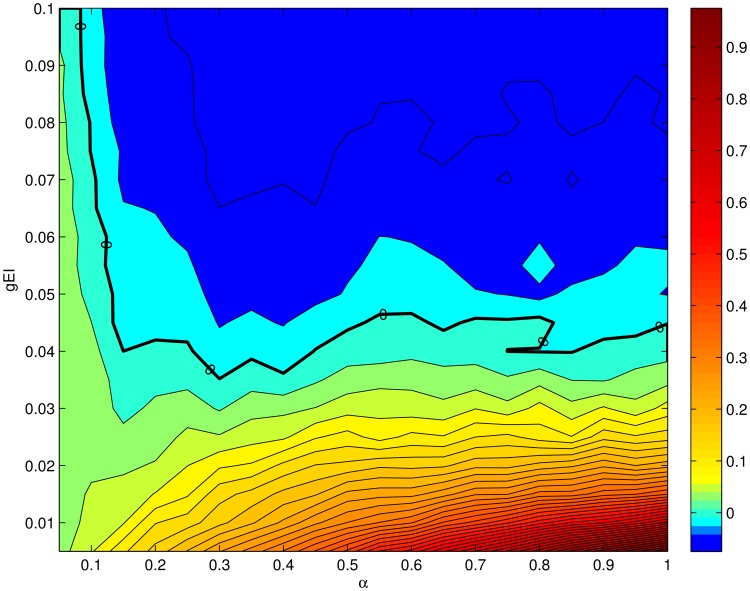
Figure 6. Gain with increasing  in the excitatory population as a function of
  and
and  for the conductance based model.
The color map shows the the slope of the spike count in the excitatory population as a function of the input current  from ORNs, normalized to a maximum of
  . The axes of the colormap are the ranges of parameters
  (x-axis) and
  (y-axis). Strict gain control corresponds to
  slope (green, thicker contour line).

