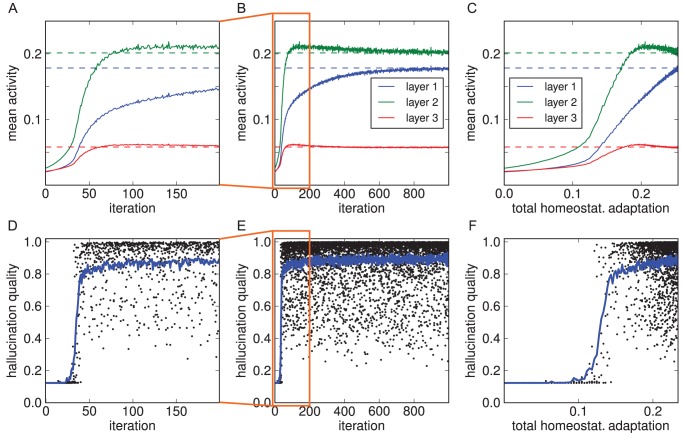
Figure 6. Emergence of hallucinations due to homeostatic adaptation.
The model was trained on the MNIST data set (results for the shapes data set were equivalent, Supplementary Figure S1). (A–C) With empty images as input, activity levels dropped in all three hidden layers and then recovered over the course of homeostatic adaptation (original levels as dashed lines; see Figure 4 for explanation of x-axes). (D–F) Quality of hallucinations (i.e. how well decoded internal representations matched the learnt images). Each dot represents the decoded internal state after the 50 sampling cycles constituting a trial (5 out of 100 trials per iteration are plotted). Blue curve denotes mean quality over 100 trials in that iteration. After an initial period of silence, hallucinations emerged abruptly, quickly rising in quality. The emergence of hallucinatory representations coincided with a more rapid recovery of activity levels.

