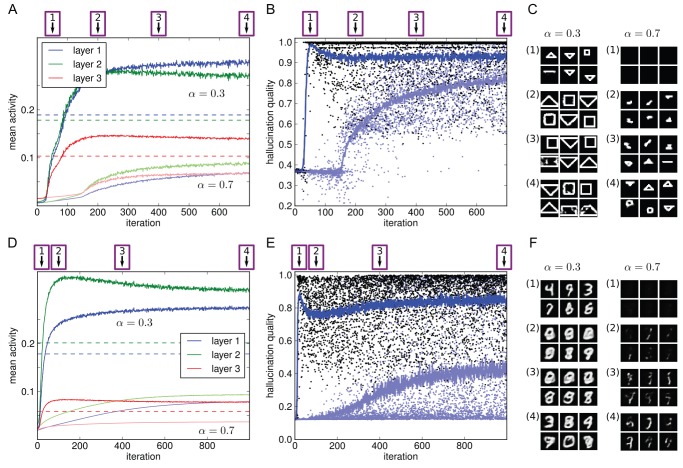
Figure 11. Hallucinations with fluctuating ACh levels.
Over the course of homeostatic adaptation, each iteration consisted of both trials with low and high values of the ACh parameter,  (dark curves, black dots) and
  (light curves, light blue dots), respectively. (A–B) Average activities and hallucination quality for the shapes model. (C) Example decoded hallucinations at time points indicated in A–B. (D–F) Analogously for the MNIST model. For both models, lower ACh levels led to hallucinations earlier and with less homoestatic adaptation. In particular, there is an early phase in which hallucinations occurred only with
  . Hallucinations that do emerge later on for
  remain weaker and less formed for most of the simulation. The difference in frequency of hallucinations also entails a corresponding difference in activity levels.

