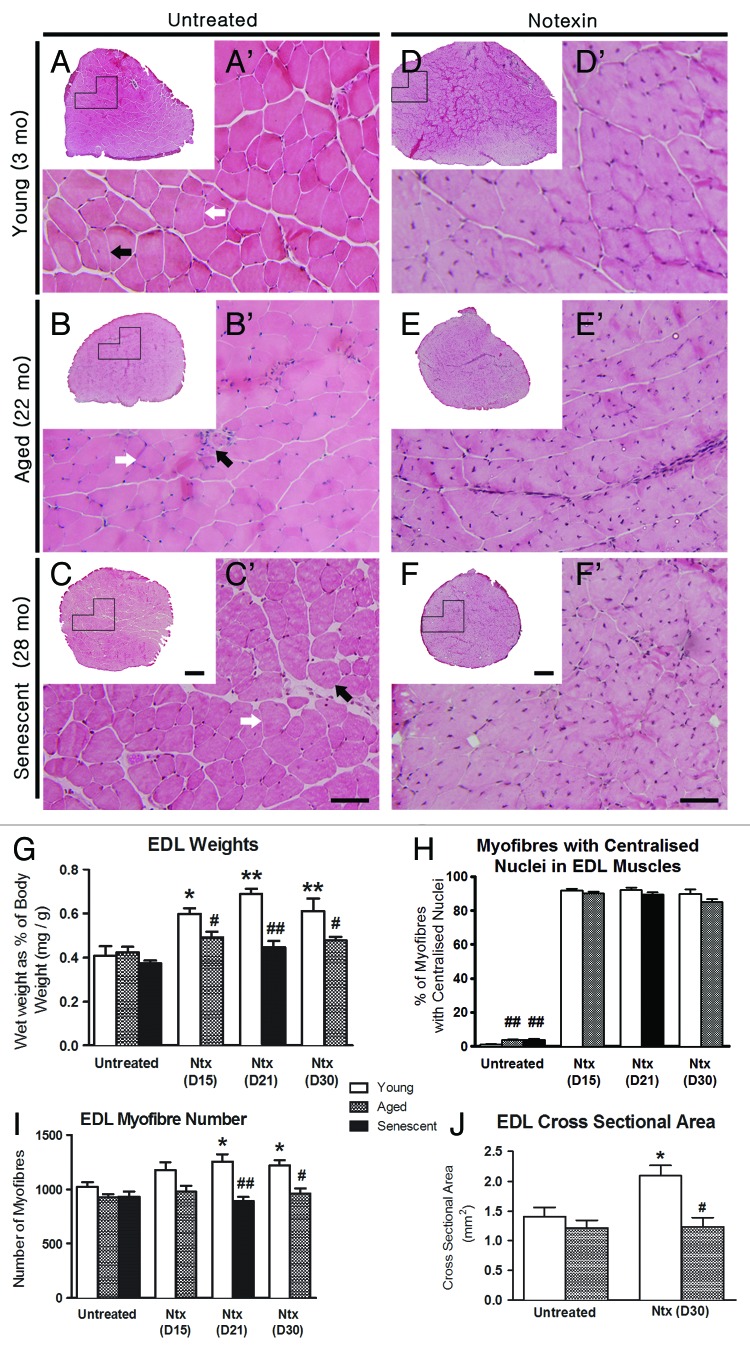
Figure 1. Regenerative response to notexin-induced injury does not differ by age. Upper panel shows representative H&E-stained sections of EDL from mice at 3 (top), 22 (middle) and 28 mo of age (bottom) mice. The left panel is untreated controls (A-C); the right panel is notexin-treated EDLs (D-F) 30 d (3 mo, 22 mo) or 21 d after notexin injury (28 mo). Images A’-F’ are higher magnifications of the boxed regions in A-F, respectively. In untreated EDLs, myofibers primarily show peripheral nuclei (white arrows) with occasional central nuclei (black arrows) at all ages. In treated EDLs, approximately 90% of myofibers show central nuclei. Data on nuclear location were collected at a higher magnification (400X) than represented here, for clear observation of fiber membranes. Scale bars: (A-F) = 200 μm; (A’- F’) = 50 μm. (G) EDL weight relative to body weight for untreated muscles and for regenerated EDL at day 15 (D15), day 21 (D21) and day 30 (D30) after notexin (Ntx) injury. (H) The percentage (%) of myofibers with central nuclei). (I) Total myofiber number. (J) Cross-sectional area of EDLs. Statistical differences are indicated as follows: * p < 0.05, ** p < 0.01 compared with untreated age-matched control group; # p < 0.05, ## p < 0.01 compared with young muscle after the same treatment.

An official website of the United States government
Here's how you know
Official websites use .gov
A
.gov website belongs to an official
government organization in the United States.
Secure .gov websites use HTTPS
A lock (
) or https:// means you've safely
connected to the .gov website. Share sensitive
information only on official, secure websites.
