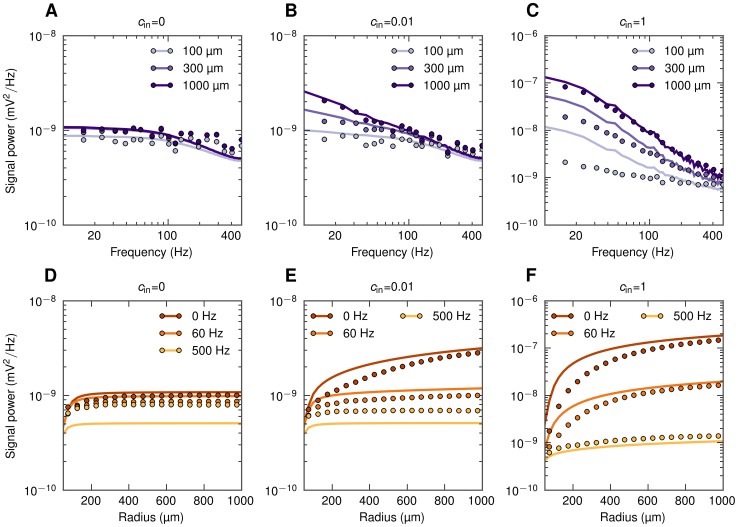
Figure 6. Power spectral density of population LFP at the soma level as a function of frequency and the population radius.
Full simulation results (dots) and simplified model predictions (lines) for the LFP at the center of disc-like populations of layer-5 pyramidal cells receiving basal synaptic input. Three different input correlation levels  are considered. A, B, C: PSD of population LFP for three population radii
  . D, E, F: dependence of power of three different frequency components on the population radius
  .
.

