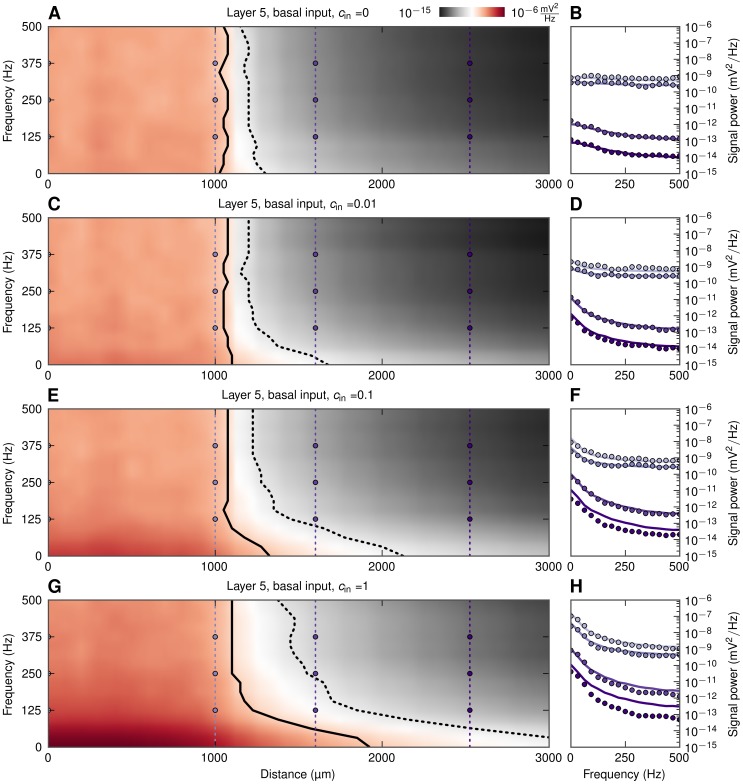
Figure 10. LFP signal power at the soma level as functions of frequency and distance from basally-activated pyramidal-cell populations.
Colormaps (A, C, E, G) show the power of extracellular signal of a population of layer-5 cells receiving basal synaptic input for four levels of input correlation  as functions of frequency and distance from center of populations. Black solid and dotted lines denote signal to noise ratio of 0.5 and 0.1, respectively. B, D, F, H: power spectra of extracellular signal at different distances, lines: prediction from simplified model in Equation 6, dots: full simulation. Thin vertical dotted lines with dots in A, C, E, G denote the distances at which the power spectra are shown, that is, at the center (
 ), population edge (
 ), and two distances outside (
 and
and  ).
).

