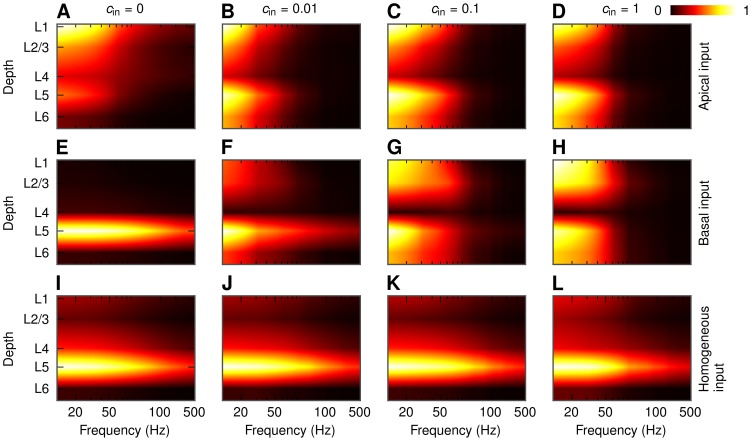
Figure 14. Simplified-model predictions of the depth-dependence of LFP power in a population of layer-5 pyramidal cells.
PSD of the LFP for different correlation levels and different patterns of synaptic input as predicted by the simplified model of the population LFP. Population radius:  . Values in each panel are normalized separately. A, B, C, D: apical synaptic input; E, F, G, H: basal synaptic input; I, J, K, L: homogeneous synaptic input. A, E, I:
  ; B, F, J:
  ; C, G, K:
  ; D, H, L:
  .
.

