
Figure 2.
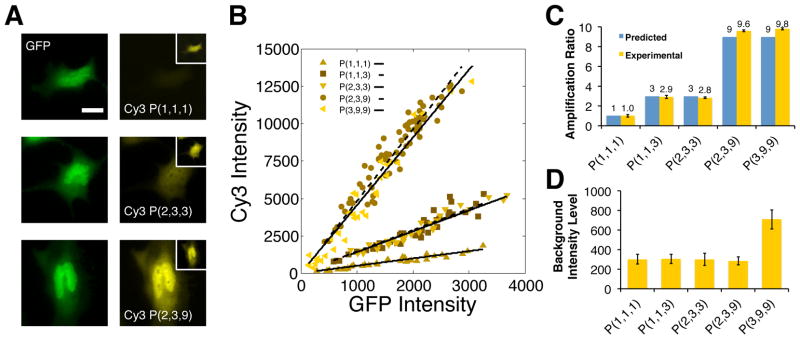
Regulating protein reporting intensities via the assembly of linear and branched DNA complexes: (A) Representative images of GFP expressing cells that are labeled through sequential displacement reactions that produce organized reporting complexes containing between 1 and 9 dyes. The number of reactions employed, labeling site/branches and dyes in a complex are indicated using the notation: P(i,j,k). All images were collected using the same exposure conditions and are contrasted identically. The inset shows maximum contrast for each image. Scale bar indicates 20 μm. (B) Correlations between average DNA-probe and GFP intensities. Each plot shows the average intensities of the cytoplasmic regions of 30 cells. The lines through the data indicate least square fits to the data (R2 ranges from 0.88–0.94). (C) Comparisons of theoretical and measured amplification ratios for the reporting complexes analyzed in B. Theoretical amplification ratios indicate the maximum number dyes that can be integrated into a complex. Experimental ratios are determined by dividing the slopes from the fits in B by the slope obtained using a linear complex containing a single dye: the P(1,1,1) complex. (D) Plots of mean background labeling intensities subtracted by dark noise and determined from intensity analyses within the cytoplasmic regions of approximately 30 non-GFP-expressing cells. Error bars indicate standard deviation of the means in C and D.