Figure 3.
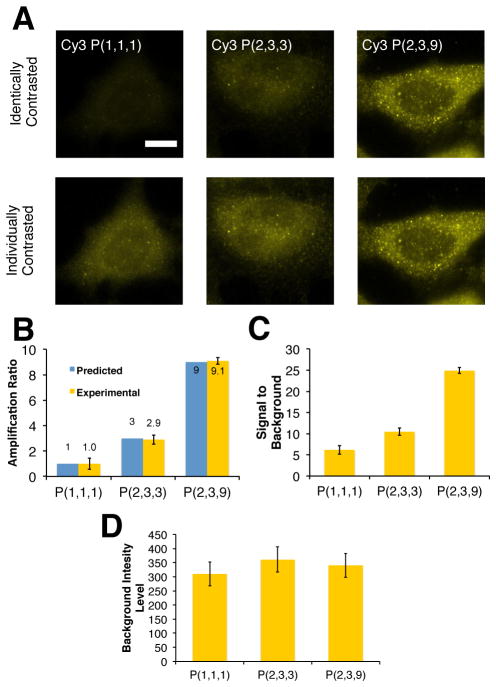
Discretely increasing amplification ratio on anti-stathmin antibody target. (A) Images of Cy3-labelled probes systems (P(1,1,1), P(2,3,3), P(2,1,9) with amplification ratios of 1×,3×,9× respectively). Equally contrasted images in the top row are taken at same imaging conditions and show similar discrete increases in amplification ratio as per Figure 2. The same images are contrasted individually in the bottom row and indicate extent of labeling for each probe system. Scale bar indicates 20 μm. (B) Comparison of experimental observed amplification ratios on modular probes targeting antibodies. Cytoplasmic regions of approximately 10 cells were taken at the same conditions for each probe system. Error bars indicate standard deviation of fluorescent signal. Fluorescent intensities were background subtracted with the mean fluorescent response from approximately 30 regions with no cells. (C) Singnal to Background ratios of modular DNA probe systems targeting antibodies. Error bars indicate standard deviation of true signal to standard deviation of background. (D) Background labeling of modular DNA probe systems targeting antibodies. GSU corresponds to grey scale units measured using a 14 bit camera. Error bars indicate standard deviations of background fluorescent labeling.

