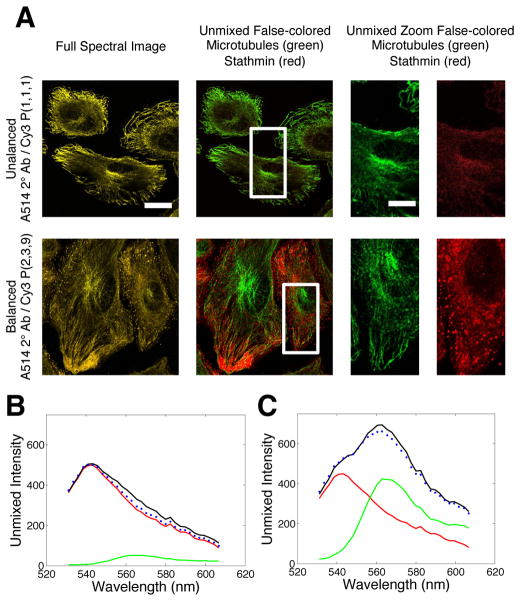
Figure 4.
Balancing marker levels within a sample to improve the unmixing of signals in hyperspectral image analyses. (A) Images of microtubules and stathmin proteins where their signals were unbalanced (top) and unbalanced (bottom) by assembling organized DNA reporting complexes possessing 1 and 9 Cy3 dye molecules respectively. Microtubules signals were labeled with Alexa514 conjugated antibodies as describe in the text. Spectrally mixed, unmixed and merged, and unmixed and separated images are provided for each experiment. Scalle bars are 20 μm. (B and C) Spectral responses of pixels within cells for cases where the stathmin and microtubule signals were unbalanced (B) and balanced (C).

