
Figure 1.
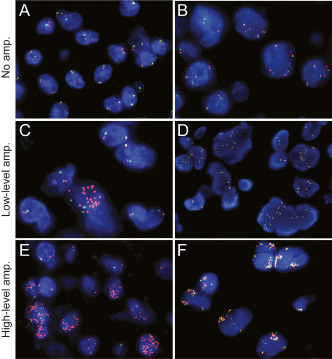
Determination of PDGFRA copy number gain/amplification by fluorescence in situ hybridization. Fluorescent images illustrating the different patterns of PDGFRA amplification in high‐grade astrocytomas. A. Normal, no increase in PDGFRA signals. B. Polysomy, >10% of cells with >2, but <6 signals for both PDGFRA and centromere enumerating probe (CEP4). C. The most frequent pattern of low‐level amplification, innumerable PDGFRA signals in <10% of cells. D. Another pattern of low‐level amplification, >40% cells with ≥6 signals (a few signals are beyond the plane of focus). E. High‐level amplification, > 10% cells with >12 or innumerable PDGFRA signals. F. Rare tumors demonstrated high‐level co‐amplification of PDGFRA and CEP4. Amp. denotes PDGFRA amplification. PDGFRA probe (red) and CEP4 (green), magnification ×1000.