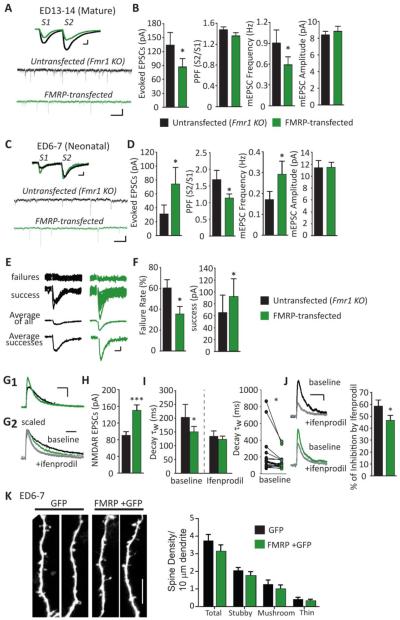
Figure 1. Acute postsynaptic transfection of FMRP bi-directionally regulates excitatory synaptic function in organotypic slice cultures prepared at different postnatal ages.
(A) Representative evoked EPSCs and mEPSCs from a simultaneous recording of an untransfected (black line) and neighboring FMRP-transfected (green line) Fmr1 KO CA1 neurons from “mature” (ED13-14) slice cultures. Scale bars: evoked EPSCs=50pA/10ms; mEPSCs=10pA/500ms. (B) Average (±SEM) of evoked EPSC amplitudes (n=28 cell pairs), paired pulse facilitation (PPF; S2/S1 evoked EPSC amplitudes; p >0.1), mEPSC frequency and amplitude (n=27) from untransfected (black filled) and FMRP-transfected (green filled) neurons at ED13-14. (C) Representative evoked EPSCs and mEPSCs from an untransfected and neighboring FMRP-transfected Fmr1 KO neuron from “neonatal” (ED6-7) slice culture. (D) Average evoked EPSC amplitude, PPF (n=26), mEPSC frequency and amplitude (n=23) from untransfected and FMRP-transfected neurons at ED6-7. (E) Representative individual traces of evoked EPSC failures and successes. Average of all EPSCs or only the successes from an untransfected and neighboring FMRP-transfected Fmr1 KO neuron. Scale bar=10pA/10ms. (F) FMRP transfection decreases the percent of failures to observe an EPSC with extracellular stimulation. When an EPSC is observed (a “success”), its amplitude is increased in FMRP transfected neurons compared to untransfected neurons (n=18). (G1) Representative pharmacologically isolated NMDAR-mediated EPSCs from an untransfected and neighboring FMRP-transfected Fmr1 KO neuron. Scale bar =50pA/100ms. (G2) Scaled NMDAR-mediated EPSCs from an untransfected and neighboring FMRP-transfected Fmr1 KO neurons before (baseline) and after ifenprodil (gray line). Scale bar=100 ms. (H) FMRP transfection increases average evoked NMDA-mediated EPSC amplitude compared to untransfected neurons (n=39). (I) Weighted time constant (τw) of the decay of NMDAR-EPSCs from untransfected and neighboring FMRP-transfected Fmr1 KO neurons before and after ifenprodil (n=19); Left: average (±SEM); Right: individual cell pairs. (J) Left: Representative NMDAR EPSCs from untransfected and neighboring FMRP-transfected Fmr1 KO neurons before and after ifenprodil. Right: Average % of inhibition of NMDAR EPSC amplitudes by ifenprodil (n=16). (K) Left: Representative segments of secondary dendrites from neonatal Fmr1 KO CA1 neurons transfected with GFP alone or FMRP + GFP. Scale bar = 10 μm. Right: Group data demonstrating that dendritic spine density of GFP+FMRP transfected Fmr1 CA1 neurons (n = 15 cells/ 2–3 dendrites per cell) is not different from neurons transfected with GFP only (n = 11) measured from all spines (total; p > 0.1) or spines of different types (stubby, mushroom or thin; p = 0.07; 2-way ANOVA). * p< 0.05; ***p< 0.001.

