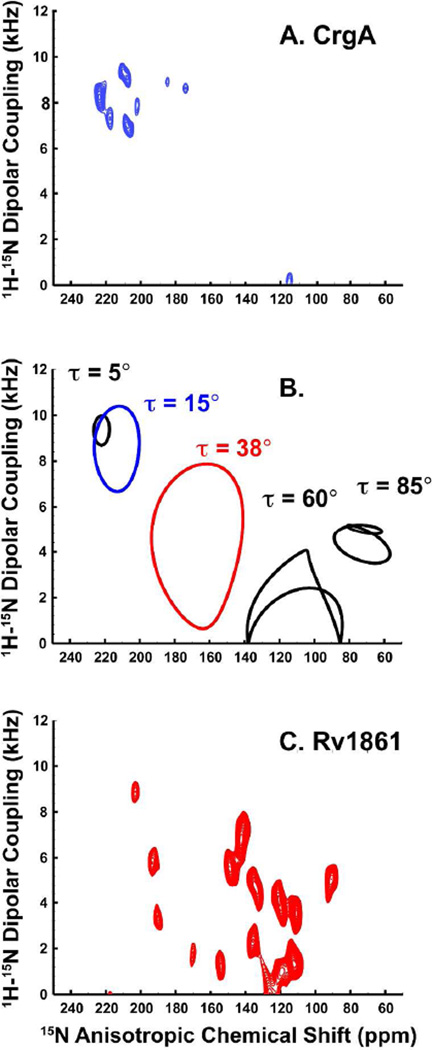
Figure 2.
Initial analysis of PISEMA spectra. A) PISEMA spectrum of CrgA 15N Phe labeled sample (residues: 33, 37, 51, 79 & 81). B) Calculated PISA wheels for different helical tilt angles. T=15° is consistent with the CrgA data in A and 38° is consistent with the data in C. C) PISEMA spectrum of Rv1861 15N Val labeled protein.

