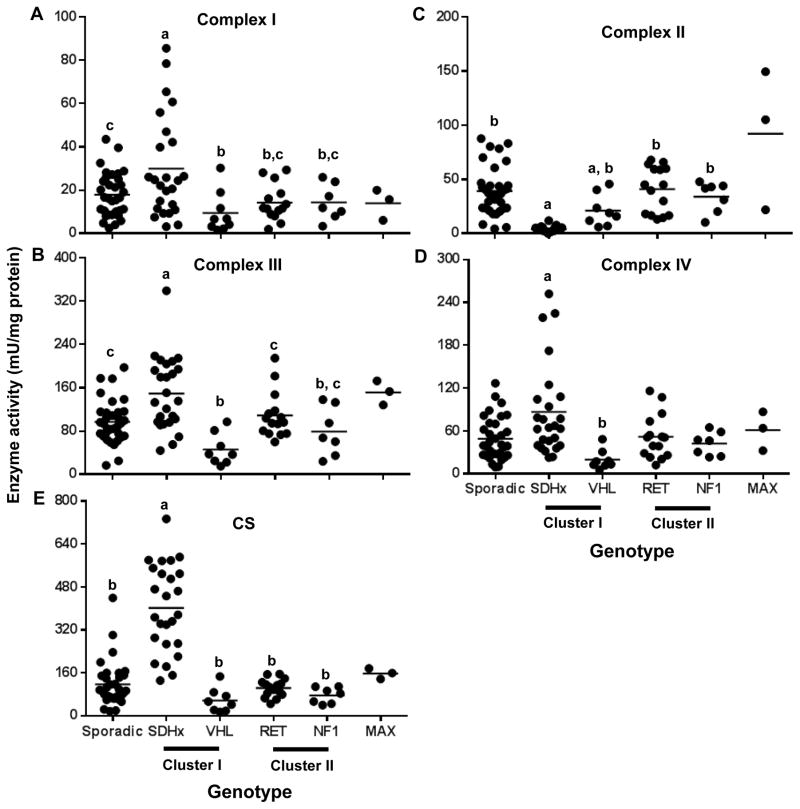
Figure 1.
Respiratory chain enzyme activity in PGL tumor tissues of different genotypes. A–E. Dot plots depicting the respiratory chain enzyme activities of respiratory chain enzyme complexes I, II, III and IV and CS across different genotypes in mU normalized to mg protein concentrations. Horizontal line represents the mean. Data sets having different alphabets above them are significantly different (p<0.05).

