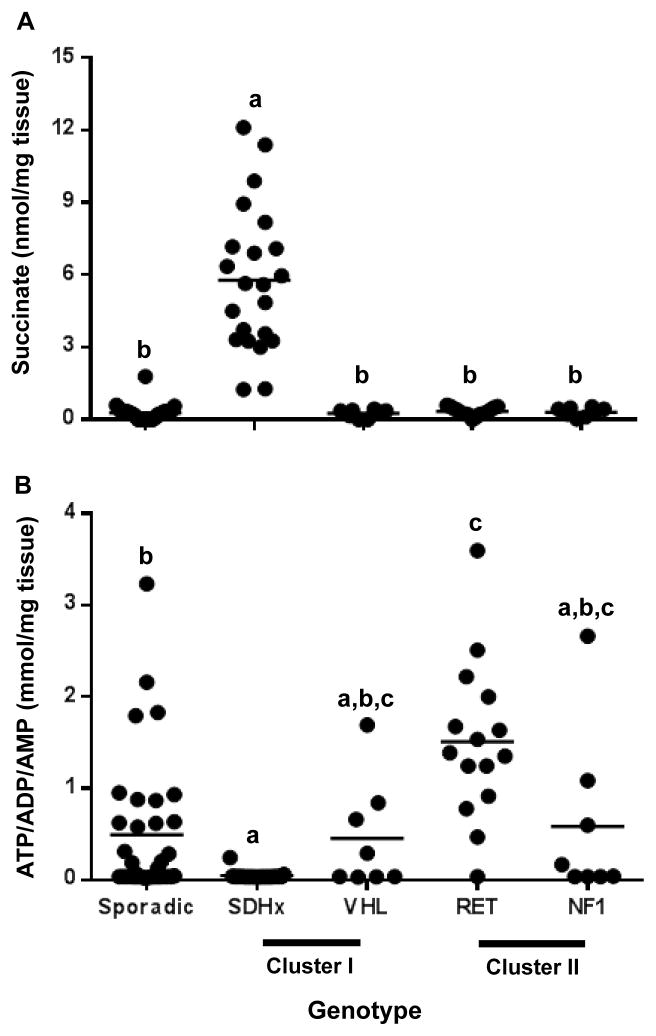
Figure 2.
Accumulation of intermediates of energy metabolism in PGL tumor tissues of different genotypes as determined by 1H-NMR spectroscopy. A. Dot plot depicting the tumor tissue succinate concentrations expressed as nmol per mg tumor tissue across different genotypes. B. Dot plot depicting the tumor tissue ATP/ADP/AMP concentrations expressed as mmol per mg tumor tissue across different genotypes. Horizontal line represents the mean. Data sets having different alphabets above them are significantly different (p<0.05). Succinate and ATP/ADP/AMP were below detection limit in 13 tumor samples and have been represented as half the lowest detectable value.

