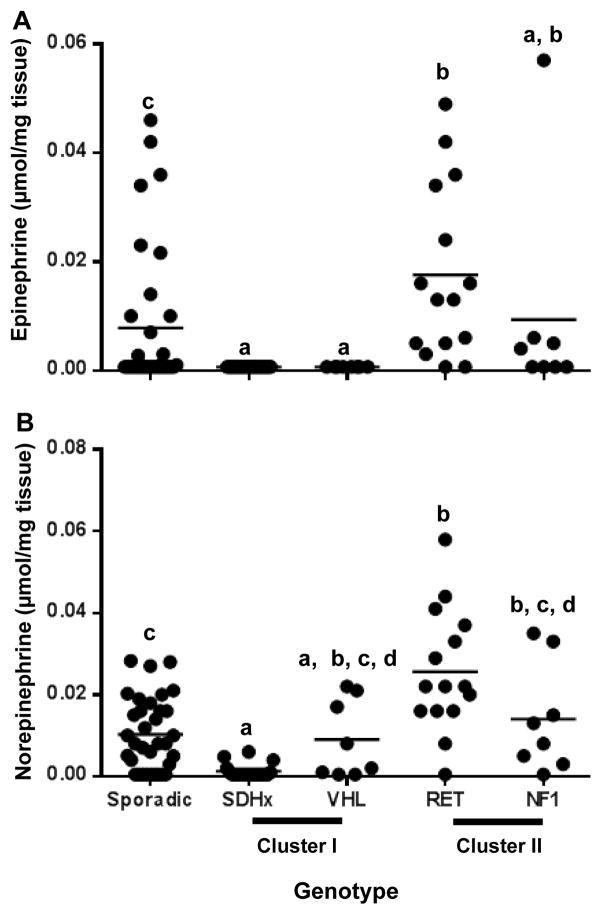
Figure 3.
Tumor tissue catecholamine content as determined by 1H-NMR spectroscopy. A. Dot plot representing the tumor tissue epinephrine concentrations expressed as μmol per mg tumor tissue across different genotypes. B. Dot plot representing the tumor tissue norepinephrine concentrations expressed as μmol per mg tumor tissue across different genotypes. Data sets having different alphabets above them are significantly different (p<0.05). Total catecholamine peaks were below detection limit in 33 tumor samples and have been represented as half the lowest detectable value. E- epinephrine, NE - norepinephrine

