
Figure 4.
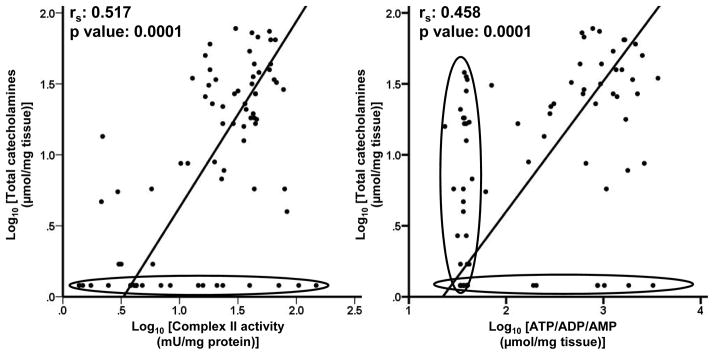
Relationship between tumor tissue catecholamine content and activity of respiratory chain enzyme complex II and tumor ATP/ADP/AMP content. Passing-Bablok regression plots for activities respiratory chain enzyme complex II (mU per mg protein) versus total catecholamine content (nmol per mg tissue) in PGL tumor tissues represented in Log10 scale. Points for samples below detection limit of 1H NMR spectroscopy are encircled in black.