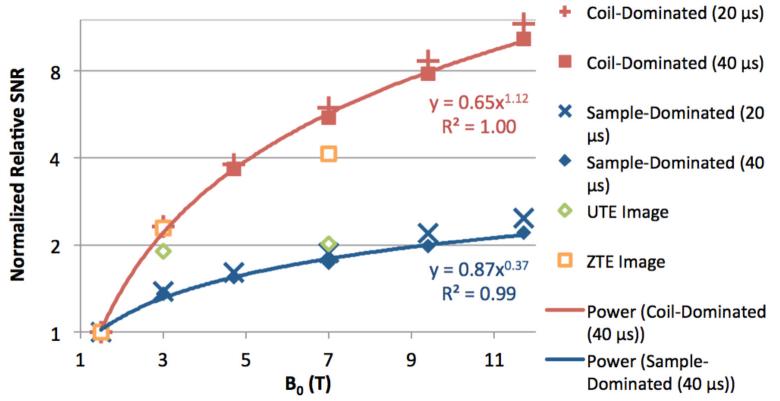
Figure 6.
Predicted (solid markers) relative bone mineral 31P SNR based on measured relaxation times at multiple field strengths at tdead = 20 and 40 μs, normalized to the value at 1.5 T for each condition, and power fits (solid lines) at tdead = 40 μs. Relative SNR trends calculated from actual UTE and ZTE imaging acquisitions (open markers), also normalized to the value at 1.5 T for each condition.

