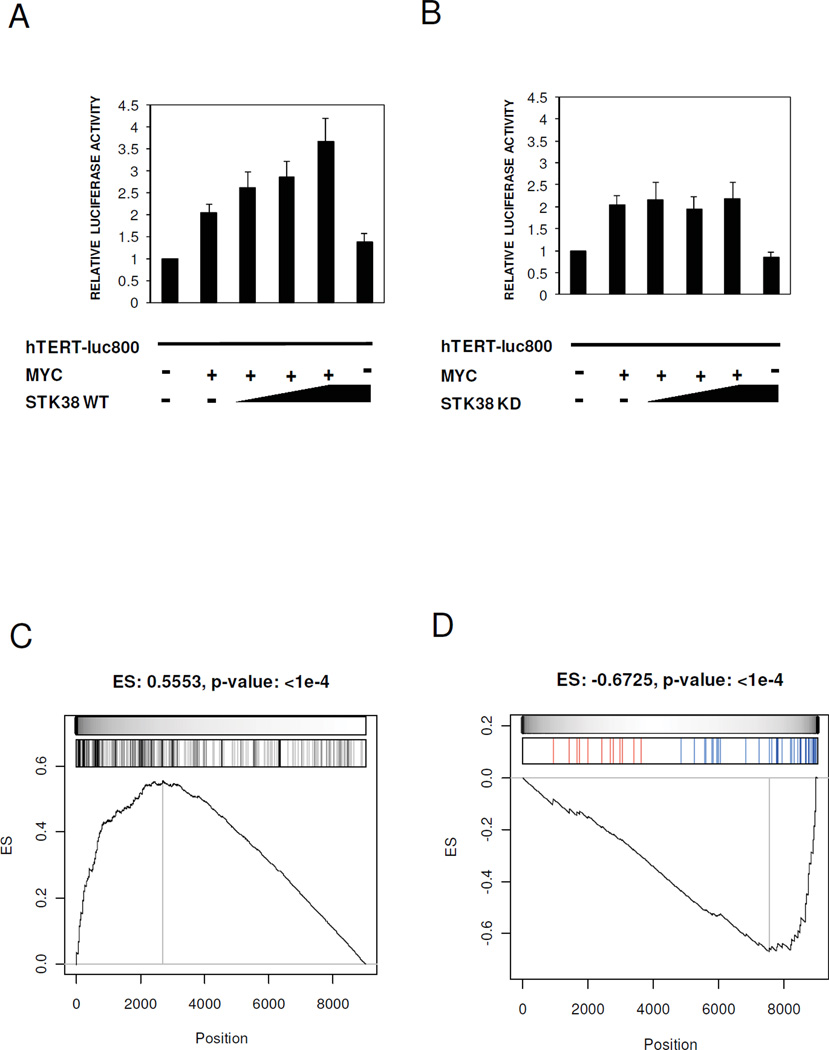
Figure 4. STK38 modulates MYC transcriptional activity.
(A, B) The U2OS cells were transiently co-transfected with STK38-WT, STK38-KD, MYC and the promoter region of hTERT. Relative luciferase activity measured in the cells co-expressing STK38-WT (A) or STK38-KD B. Bars represent the mean ±SEM of three independent experiments. (C) GSEA of 258 MYC target genes on the expression profile of ST486 after STK38 knock-down. (D) GSEA of 47 genes known to be transcriptionally activated by MYC. Shown is the enrichment running sum (black line) and its maximum value or enrichment score (ES with associated p-value as headline of each panel). The grey scale bar is proportional to the weight used for each hit (MYC target gene) used by the GSEA algorithm. The bar-code plots indicate the position of MYC target genes on the gene expression profile. The leading edge genes are the group of MYC target genes located to the left (in panel C) and to the right (in panel D) of the grey vertical line. Upregulated and downregulated MYC target genes after STK38 knock-down are shown in red and blue, respectively, in the bar-code plot of panel (D).

