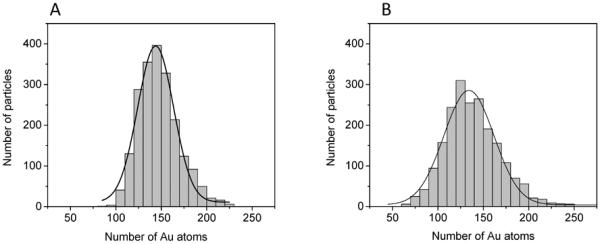
Figure 3.

Histograms of integrated intensities represented in terms of number of gold atoms for (A) Au(pMBA) and (B) Au(GSH) AuNPs. Fitted Gaussian functions are centered at 144 and 134 atoms in (A) and (B), respectively. Size of histogram bin is 10 atoms.
