
Figure 5.
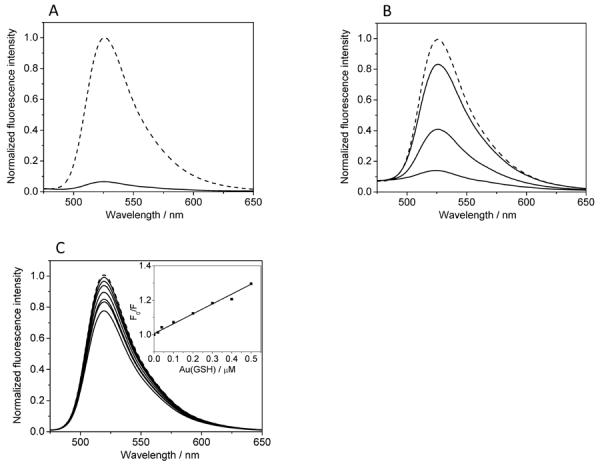
Binding of TAT to Au(GSH) assessed by fluorescence quenching. (A) Fluorescence emission spectra from a 1 μM solution of FAM-labeled TAT in the absence (dashed curve) and presence of 0.5 μM Au(GSH). (B) Fluorescence spectra from a 1 μM solution of Au(GSH)-TAT in the presence of 0, 0.25 and 1 M NaCl (from bottom to top). Dashed curve corresponds to a 1 μM control solution of FAM-labeled TAT. (C) Fluorescence emission spectra from a 1 μM solution of FAM in the presence of increasing amounts of Au(GSH) (from top to bottom: 0.02, 0.04, 0.1, 0.2, 0.3, 0.4, 0.5 μM). Dashed curve corresponds to a 1 μM control solution of FAM. Inset is a Stern-Volmer plot obtained using the fluorescence data in (C).