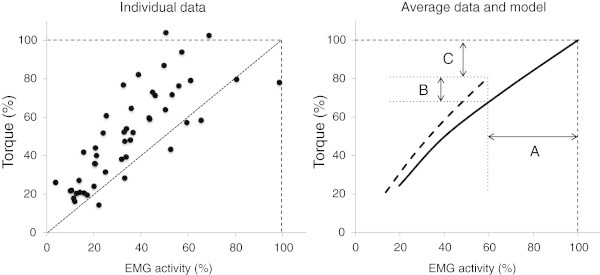
Figure 3.

Relation between plantar flexion torque andsoleusEMG activity expressed in percentage of the maximal values in temperate environment. Left panel: individual values during contraction ranging from 25% to 100% of MVC in a hot environment (HOT-core). Note that most values are above identity line (i.e., higher torque for a given EMG or lower EMG for a given torque in a hot environment as compare to a temperate environment). Right panel: Average relationship between torque and EMG in temperate (plain line) and hot (dashed line) environment. Note that the decrease in torque (C) is function of the decrease in EMG activity (A) minus the improvement in contractile properties (B).
