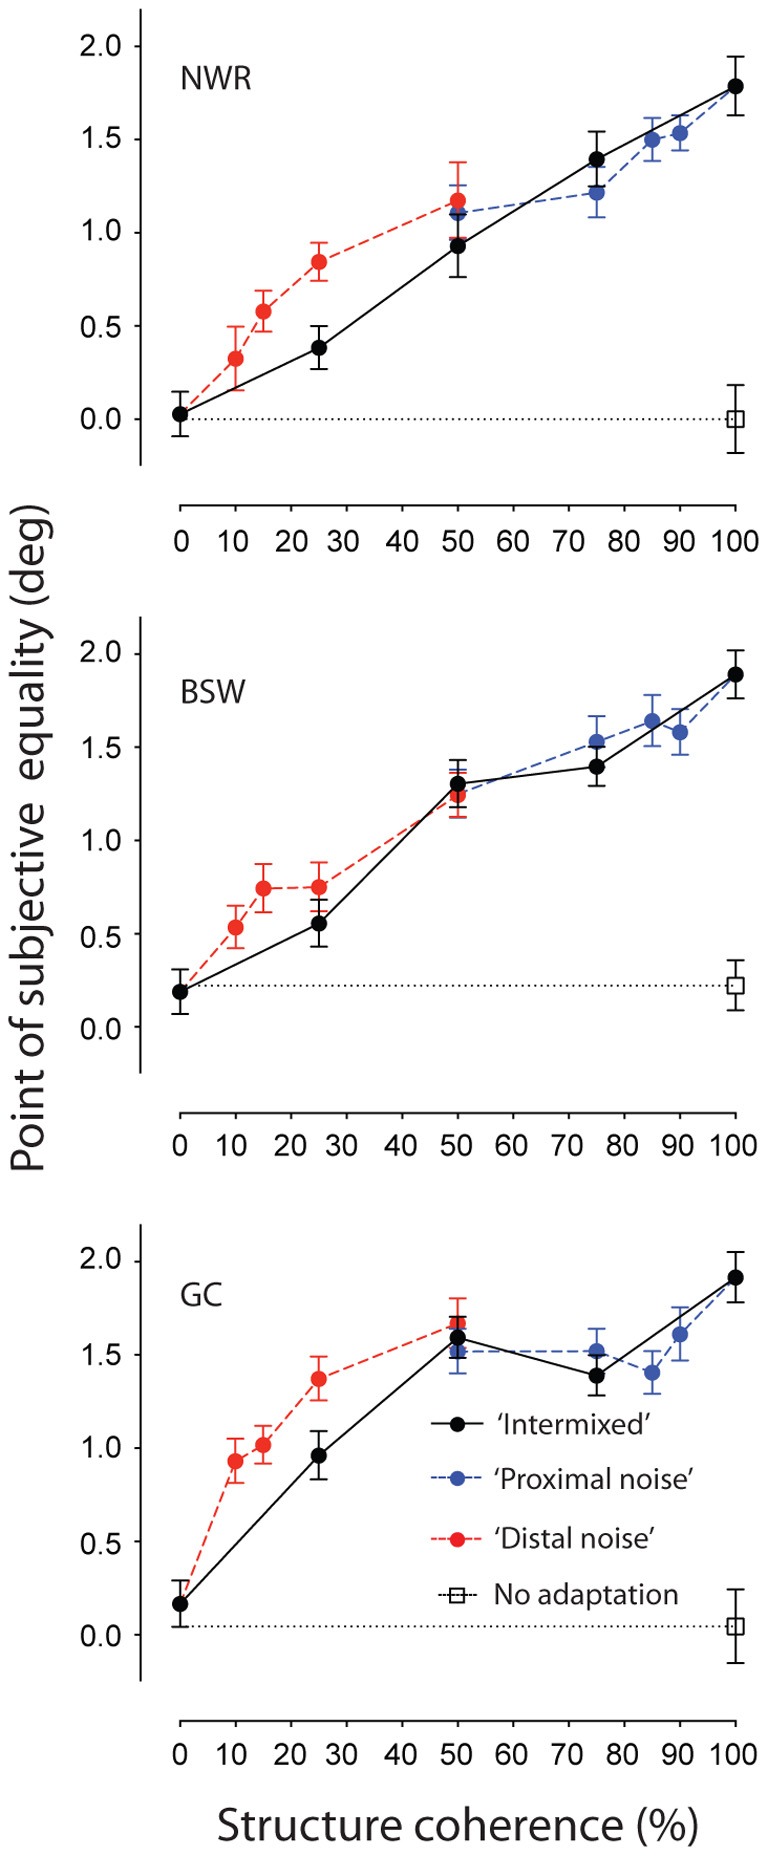
Figure 2.

Spatially remote TAEs-induced by adaptation to noisy concentric texture patterns with different spatial configurations. Points of subjective equality are plotted as a function of signal to noise ratio for three individual observers. Black filled symbols represent performance where randomly oriented noise elements were distributed across the texture pattern (see Figure 1B). Red and blue symbols represent performance when noise elements were positioned inside (Figure 1C) or outside (Figure 1D) an annular region surrounding the test site, respectively. Unadapted (baseline) performance is shown by the unfilled black symbol. Error bars indicate ± 1 standard error.
