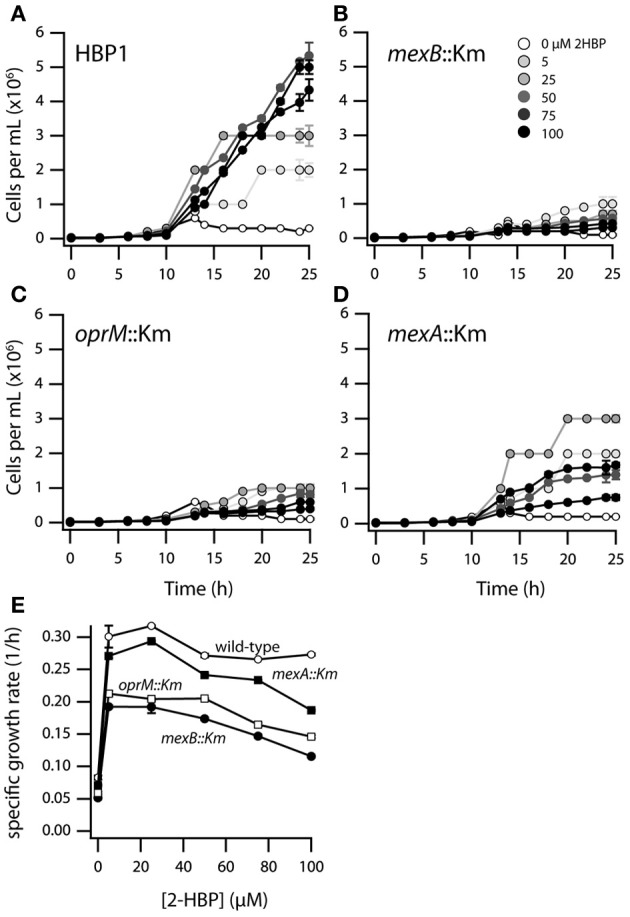
Figure 2.

Growth of P. azelaica HBP1 wild-type, mexA::Km, mexB::Km, and oprM::Km mutants on low concentrations of 2-HBP. (A–D) Population growth over time as function of 2-HBP concentration. (E) Calculated maximum specific growth rates for wild-type or mutants as a function of 2-HBP concentration.
