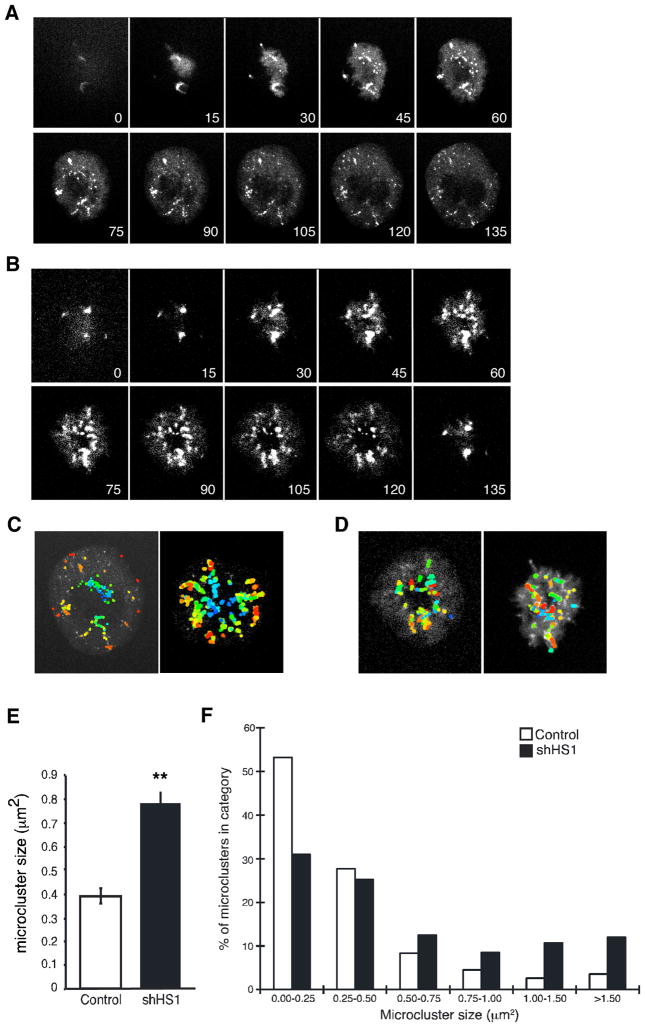
FIGURE 8.
HS1 regulates PLCγ1 microcluster dynamics. A, Jurkat cells stably expressing PLCγ1-eYFP were transfected with empty vector, plated on coverslips coated with anti-CD3, and imaged by confocal microscopy. Selected images from one time-lapse series are shown; these correspond to supplemental Video 7. B, Jurkat cells stably expressing PLCγ1-eYFP were transfected with HS1 suppression vector and analyzed as in A. Selected images from one time-lapse series are shown; these correspond to supplemental Video 9. C and D, PLCγ1 microclusters in empty vector (C) or HS1-suppressed (D) T cells were identified and color coded by order of appearance, with newer microclusters colored orange and red, and older microclusters colored blue and green. Left-hand panels, Cells from the sequences shown in A and B. Right-hand panels, Additional examples. E, The area of individual microclusters was determined at 90 s after the initiation of contact with the coverslip. At least 20 cells were analyzed per condition, yielding ~400 microclusters each. Data represent mean ± SEM. **, p < 0.0001. F, The areas of individual microclusters from E were grouped into the indicated bins. The percentage of total microclusters falling into each size category is shown.

