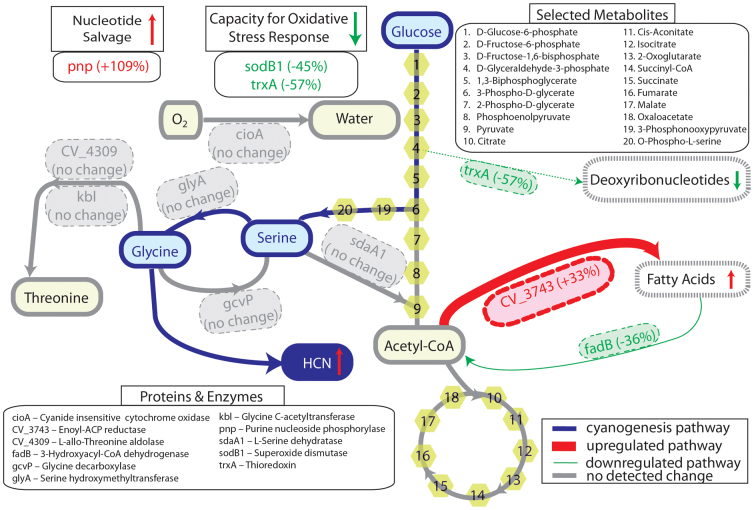
Figure 7. Comparative proteome analyses after increased cyanogenesis in Chromobacterium violaceum.
The cyanogenic pathway is highlighted in blue. Up-regulations are represented in red, and down-regulations are represented in green. The identities of proteins and enzymes detected in the study are shown in Supplementary Table S1.

