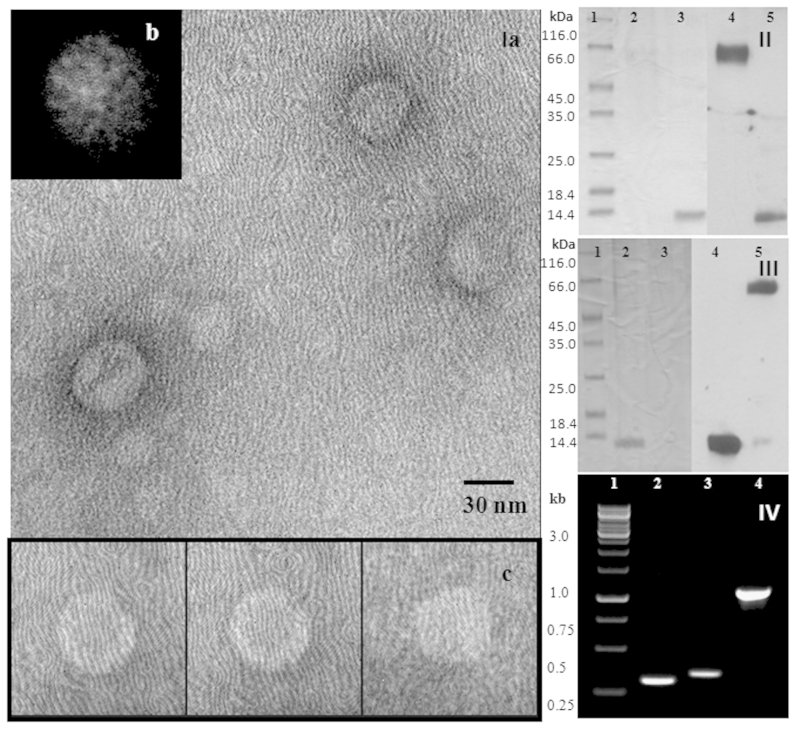
Figure 6.
Panel I (a): TEM image of phage AbDs1. Out of the 50 isolated particles used for generating a class average, a few selected virions are shown in panel (c). The icosahedral features that are seen in the class average generated using the EMAN software tool, confirms the formation of virions (panel b). Panel (II) shows a western blot analysis of immune-purified phage AbDs1 using Orf96-specific antibodies. Lane 1 represents the molecular mass marker, lanes 2 and 3 are loaded with phage proteins and recombinant Orf96, respectively. Lanes 4 and 5 show the corresponding western blots. The western blot performed using Orf106-specific antibodies is shown in panel (III). Lanes 2 and 3 represent recombinant Orf106 and proteins of phage AbDs1, respectively. Lanes 4 and 5 show the corresponding western blots. Amplification of pTS236-specific ORFs from immune-purified AbDs1 phage particles is shown in panel (IV). Lane 1 represents kilo base ladder. Lanes 2, 3 and 4 show amplification of orf96, orf106 and repA, respectively.

