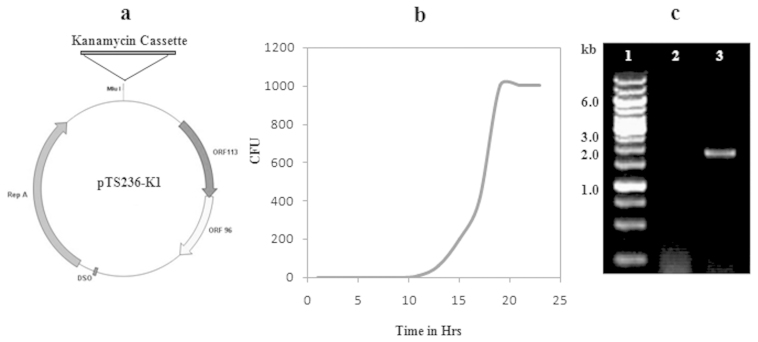
Figure 7.
Panel (a) indicates physical map of pTS236-K1. Panel (b) indicates the generation of kanamycin resistant Acinetobacter sp. DS002 colonies after infection with AbDs1 (pTS236-K1). Amplification of the kanamycin gene from immune-purified phage particles, AbDs1 (pTS236-K1), is shown in panel (c). Lane 1 represents the kilobase ladder, lanes 2 and 3 are loaded with the PCR-amplified kanamycin gene from AbDs1 and AbDs1 (pTS236-K1).

