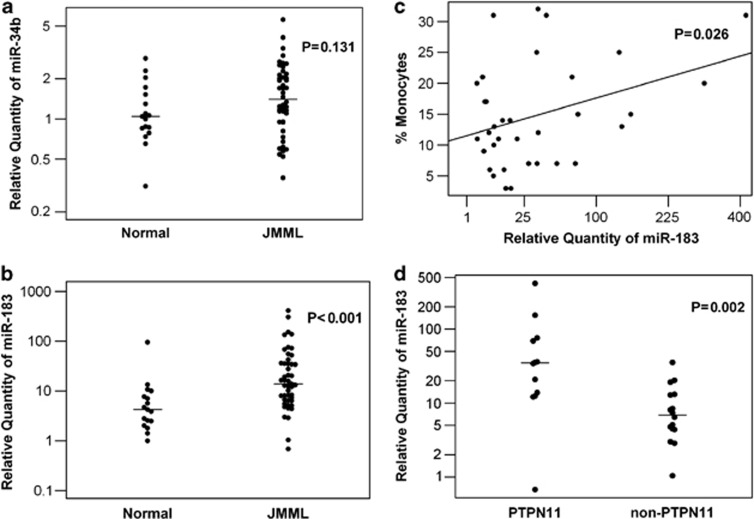
Figure 2.
(a) miR-34b expression levels of MNCs were quantified by real-time qRT-PCR. Total RNA was extracted from unstimulated MNCs from PB or BM of patients or normal controls. Dots show the miR-34b expression levels in normal controls (n=17) or JMML patients (n=47). The bars indicate the median levels of each group. (b) miR-183 expression levels of MNCs were quantified by real-time qRT-PCR as miR-34b. Dots show the miR-183 expression levels in normal controls (n=17) or JMML patients (n=47). The bars indicate the median levels of each group. (c) Linear correlation between miR-183 expression levels in MNCs and the monocyte percentages in PB of JMML patients (n=34, P<0.05). (d) miR-183 expression levels of MNCs in patients with or without PTPN11 mutation. Dots show the miR-183 expression levels in patients with PTPN11 mutation (n=12) or without (n=16). The bars indicate the median levels of each group.

